Full Report
The numbers behind PT Metrodata Electronics Tbk: as-reported financial statements and company metrics for FY2022–FY2025, traced to the source filings, opened with the share-price history those statements have to justify. Every linked figure opens the exact page of the filing it was printed on, with the statement row highlighted. Amounts in Rp millions unless noted.
Reading notes: All figures are consolidated and stated in millions of Rupiah, exactly as printed in the filings' financial statements ("Expressed in millions of Rupiah"). The provider numeric feed for this run contained ONLY a balance sheet (data/financials/balance_sheet.json); income statement, cash flow, and segment revenue are 100% sourced from the audited filings. The feed's balance-sheet figures reconcile exactly to the filings for every overlapping year (FY2020–FY2025), so no discrepancies are logged. FY2022–FY2025 are all filing-cited. Each year is cited to its own annual report where available (FY2025→FY2025 AR, FY2024→FY2024 AR, FY2023→FY2023 AR); FY2022 is the comparative column of the FY2023 annual report (no FY2022 annual report is in the corpus). FY2016–FY2021 shareholders' equity in the Long-Term Record is from the standardized data feed (stockanalysis.com, reconciled to filed statements) and is shown without page links; no pre-FY2022 income statement or cash-flow data was available in the corpus or feed.
Share Price — Available History Since January 2026
The stock closed at IDR 510.00 on Jul 27, 2026 — down 12% over the window shown, trading between IDR 488.00 and IDR 605.00. At that close the stock trades at 7.7× FY2025 diluted EPS as reported below.
Source: market price feed, daily closes, Jan 2026–Jul 2026 — the feed marks this available history as partial. Price return only, excludes dividends.
FY2025 at a Glance
Net income (Rp millions)
Diluted EPS
Source: FY2025 consolidated statements [1] [2] [3]. Click any linked figure to open the filing page with the row highlighted.
Revenue by Segment (External Sales)
| Revenue by Segment (External Sales) | FY2022 | FY2023 | FY2024 | FY2025 |
|---|---|---|---|---|
| Distribution | 15,958,796 | 15,877,843 | 18,961,147 | 20,713,495 |
| Solution and consultation | 5,029,501 | 6,208,547 | 6,187,791 | 6,464,264 |
| Total net revenue | 20,988,297 | 22,086,390 | 25,148,938 | 27,177,759 |
| Total net revenue growth, derived | — | +5.2% | +13.9% | +8.1% |
Source: Note 25 Segment Information — external sales by operating division (Distribution; Solution and consultation) [4] [5] [6] [7]. Click any linked figure to open the filing page with the row highlighted.
Gross Profit by Segment
| Gross Profit by Segment | FY2022 | FY2023 | FY2024 | FY2025 |
|---|---|---|---|---|
| Distribution | 1,011,553 | 1,057,980 | 1,227,367 | 1,276,767 |
| Solution and consultation | 729,247 | 859,446 | 928,612 | 949,961 |
| Total segment gross profit | 1,740,800 | 1,917,426 | 2,155,979 | 2,226,728 |
Source: Note 25 Segment Information — gross profit by operating division (before consolidation elimination) [4] [5] [6] [7]. Click any linked figure to open the filing page with the row highlighted.
Income Statement
Source: Consolidated Statements of Profit or Loss and Other Comprehensive Income [1] [2] [3]. Click any linked figure to open the filing page with the row highlighted.
Columns marked E are consensus analyst estimates from S&P Capital IQ (CapIQ), shown alongside reported results for direct comparison; they are not company guidance.
Estimate source: S&P Capital IQ (CapIQ) consensus, as of 2026-07-27. Estimate figures are S&P Capital IQ consensus (vendor data — no filing page links). EPS and net income use the normalized (adjusted) consensus where the street reports it.
Balance Sheet
Source: Consolidated Statements of Financial Position [8] [9] [10] [11]. Click any linked figure to open the filing page with the row highlighted.
Cash Flow
Source: Consolidated Statements of Cash Flows [12] [13] [14]. Click any linked figure to open the filing page with the row highlighted.
Profitability Returns
| Profitability Returns | FY2022 | FY2023 | FY2024 | FY2025 |
|---|---|---|---|---|
| Operating income (Laba Usaha) | 1,124,830 | 1,196,470 | 1,386,900 | 1,435,570 |
| Operating income margin | 5.4% | 5.4% | 5.5% | 5.3% |
| Gross profit margin | 8.2% | 8.7% | 8.6% | 8.2% |
| Net profit margin | — | — | 2.9% | 3.0% |
| Return on equity (ROE) | 18.0% | 17.6% | 17.6% | 17.3% |
| Return on assets (ROA) | 6.8% | 6.4% | 6.3% | 6.2% |
Source: company filings [15] [16]. Click any linked figure to open the filing page with the row highlighted.
Balance-Sheet Strength
| Balance-Sheet Strength | FY2022 | FY2023 | FY2024 | FY2025 |
|---|---|---|---|---|
| Net working capital | 3,869,430 | 4,464,850 | 4,931,010 | 5,589,370 |
| Current ratio | 2.0 | 1.9 | 1.9 | 1.9 |
| Total liabilities to total assets | 48.5% | 50.4% | 51.4% | 51.9% |
Source: company filings [16]. Click any linked figure to open the filing page with the row highlighted.
Per-Share Shareholder Returns
| Per-Share Shareholder Returns | FY2022 | FY2023 | FY2024 | FY2025 |
|---|---|---|---|---|
| Operating income per share | 91.62 | 97.46 | 112.97 | 116.93 |
| Cash dividend per share (from fiscal-year earnings) | 14.5 | 21.0 | 24.0 | — |
| Cash dividend payout ratio (of fiscal-year net income) | 30.7% | 39.6% | 39.8% | — |
Source: company filings [17] [16]. Click any linked figure to open the filing page with the row highlighted.
Segment Economics (Distribution vs Solution Consultation)
| Segment Economics (Distribution vs Solution Consultation) | FY2022 | FY2023 | FY2024 | FY2025 |
|---|---|---|---|---|
| Distribution — profit before tax | 741,136 | 747,316 | 837,016 | 843,039 |
| Solution consultation — profit before tax | 408,160 | 476,855 | 540,172 | 591,548 |
| Distribution — segment assets | 4,572,852 | 5,430,198 | 6,308,244 | 7,146,090 |
| Solution consultation — segment assets | 3,971,033 | 4,749,210 | 5,455,453 | 6,003,542 |
Source: company filings [4] [5] [6] [7]. Click any linked figure to open the filing page with the row highlighted.
Human Capital Customers
| Human Capital Customers | FY2022 | FY2023 | FY2024 | FY2025 |
|---|---|---|---|---|
| Total employees (headcount) | — | 4,298 | 4,411 | 4,293 |
| Employee turnover rate | — | 21.7% | 16.9% | 18.2% |
| Total training hours delivered | — | 2,975 | 2,145 | 2,078 |
| Customer satisfaction survey (scale 1-4) | — | 3.48 | 3.38 | 3.59 |
Source: company filings [18] [19]. Click any linked figure to open the filing page with the row highlighted.
Long-Term Record
| Fiscal year | Total revenue | Net income attributable to owners | Diluted EPS | Operating cash flow | Shareholders' equity |
|---|---|---|---|---|---|
| FY2016 | — | — | — | — | 1,849,299 |
| FY2017 | — | — | — | — | 2,201,718 |
| FY2018 | — | — | — | — | 2,600,231 |
| FY2019 | — | — | — | — | 3,042,855 |
| FY2020 | — | — | — | — | 3,415,710 |
| FY2021 | — | — | — | — | 3,922,653 |
| FY2022 | 20,988,297 | 580,496 | 47 | 126,871 | 4,416,863 |
| FY2023 | 22,086,390 | 650,766 | 53 | (74,070) | 5,038,136 |
| FY2024 | 25,148,938 | 739,805 | 60 | 273,304 | 5,661,702 |
| FY2025 | 27,177,759 | 813,992 | 66 | (70,178) | 6,314,804 |
Source: consolidated statements across filings; older years from the standardized feed [12] [1] [8] [13]. Click any linked figure to open the filing page with the row highlighted.
Analyst Consensus
Mean target
Median target
High target
Low target
Street ratings: 2 strong buy, 1 buy. Consensus: Strong Buy.
Estimate source: S&P Capital IQ (CapIQ) consensus, as of 2026-07-27. Estimate figures are S&P Capital IQ consensus (vendor data — no filing page links). EPS and net income use the normalized (adjusted) consensus where the street reports it.
Traceability
315 of 323 figures on this page (98%) link to the filing page where they are printed — click a linked figure to open the source PDF at that page with the row highlighted. Unlinked figures come from standardized data feeds or pre-filing years.
All figures are consolidated and stated in millions of Rupiah, exactly as printed in the filings' financial statements ("Expressed in millions of Rupiah").
The provider numeric feed for this run contained ONLY a balance sheet (data/financials/balance_sheet.json); income statement, cash flow, and segment revenue are 100% sourced from the audited filings. The feed's balance-sheet figures reconcile exactly to the filings for every overlapping year (FY2020–FY2025), so no discrepancies are logged.
FY2022–FY2025 are all filing-cited. Each year is cited to its own annual report where available (FY2025→FY2025 AR, FY2024→FY2024 AR, FY2023→FY2023 AR); FY2022 is the comparative column of the FY2023 annual report (no FY2022 annual report is in the corpus).
FY2016–FY2021 shareholders' equity in the Long-Term Record is from the standardized data feed (stockanalysis.com, reconciled to filed statements) and is shown without page links; no pre-FY2022 income statement or cash-flow data was available in the corpus or feed.
Operating-expense line: FY2024/FY2025 filings label it "Operating expenses"; the FY2023 filing labels the identical line "Selling, general and administrative expenses" (the quote text reflects each filing's own wording).
Segment gross profit (Gross Profit by Segment) is shown before the small consolidation elimination; the sum of the two segments equals the note's pre-elimination total, which differs from the income-statement consolidated gross profit by the elimination (e.g. FY2025: segments 2,226,728 vs consolidated 2,232,544, a +5,816 elimination).
Short-term borrowings and long-term bank loans were nil in FY2022 (printed as "-"); those two cells carry the value 0 without a page link (a dash has no highlightable figure).
Quarterly single-quarter figures are derived from cumulative year-to-date interim statements (MTDL interims print only cumulative income and cash-flow columns, not stand-alone quarters); every derived value reconciles exactly to the difference of two printed year-to-date figures, and each derived cell is marked "derived":"ytd_diff" and anchored to the printed cumulative row. Q1 FY25 and Q1 FY26 are printed three-month figures. Derived Q4 FY25 revenue (8,371,986m) and Q1 FY26 revenue (6,711,485m) independently match the amounts reported in the Investing.com earnings calendar (~Rp8.37T and ~Rp6.71T). No quarterly cash-flow feed was available to cross-check the derived operating quarters.
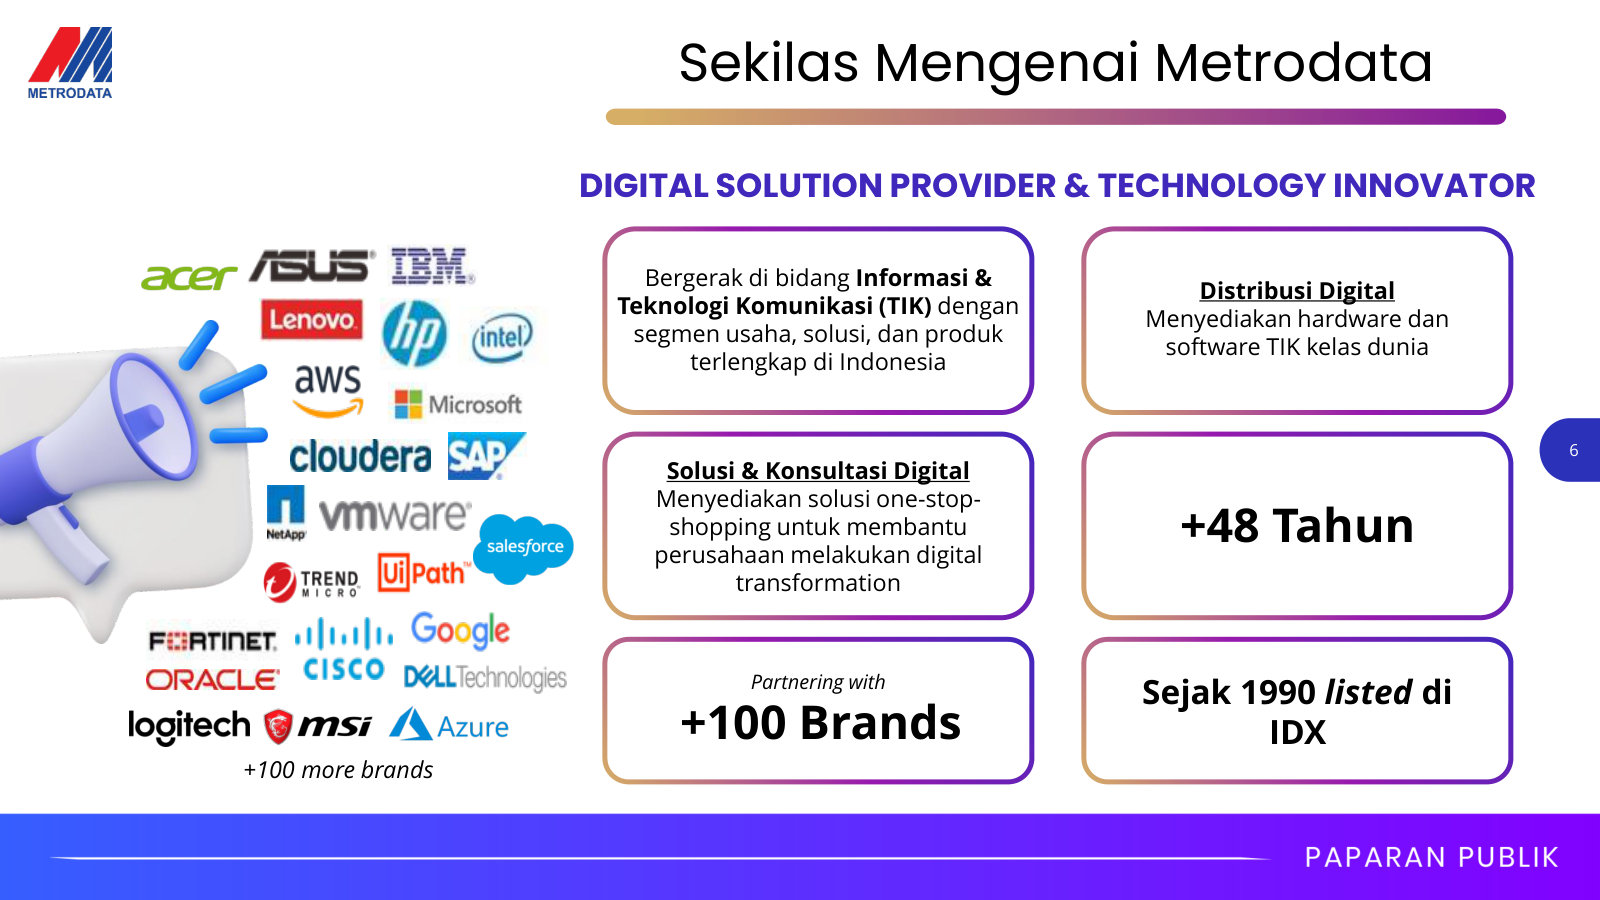
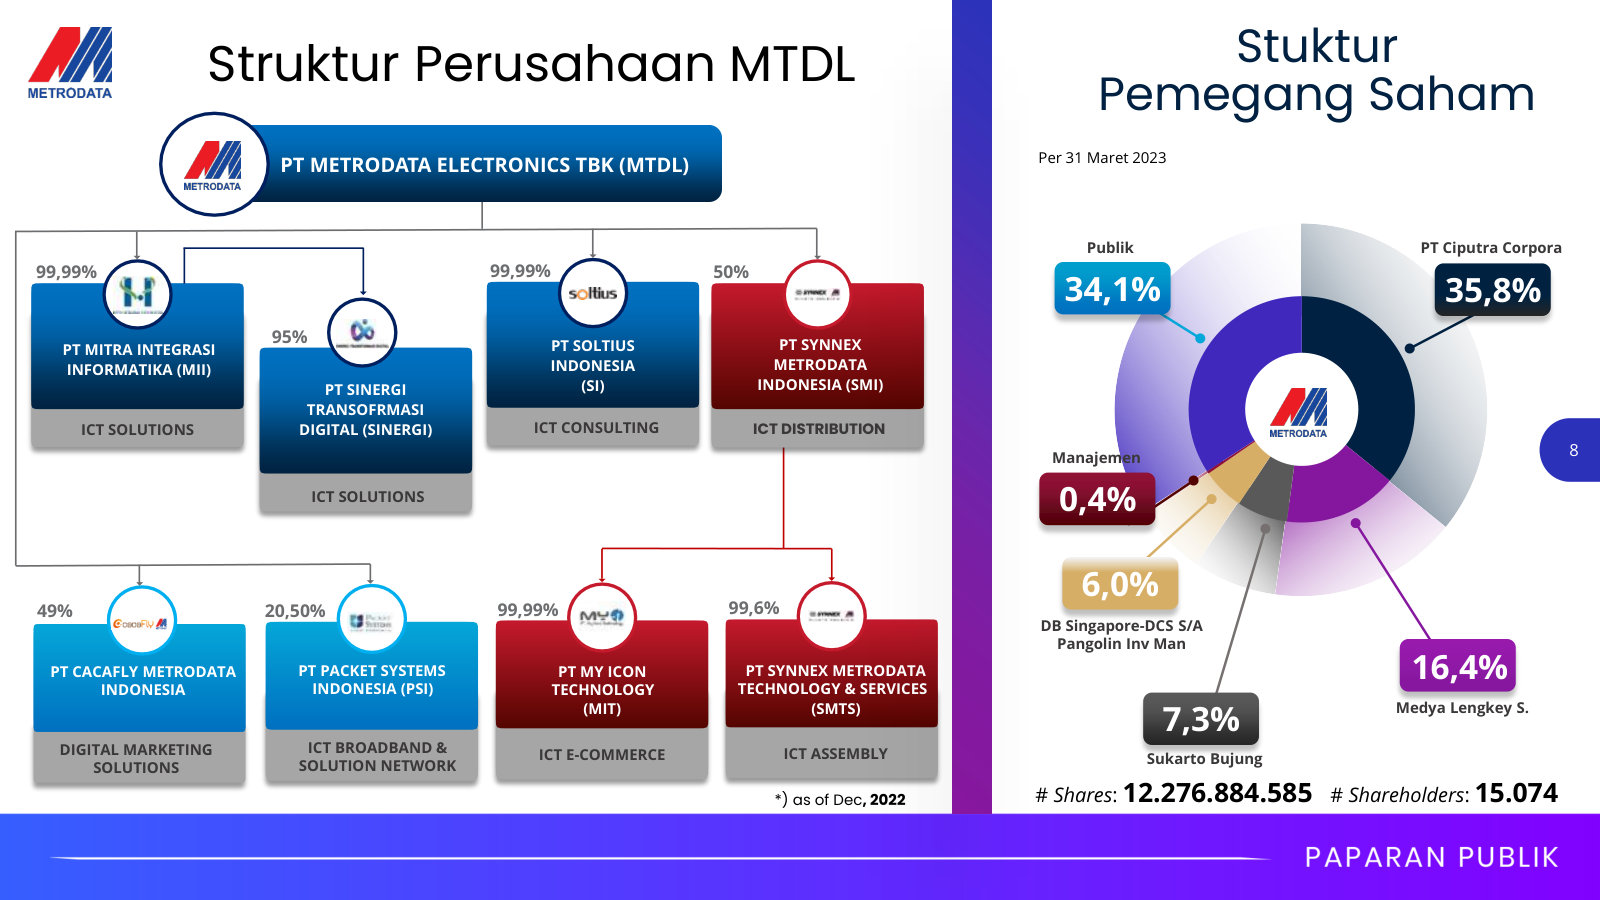
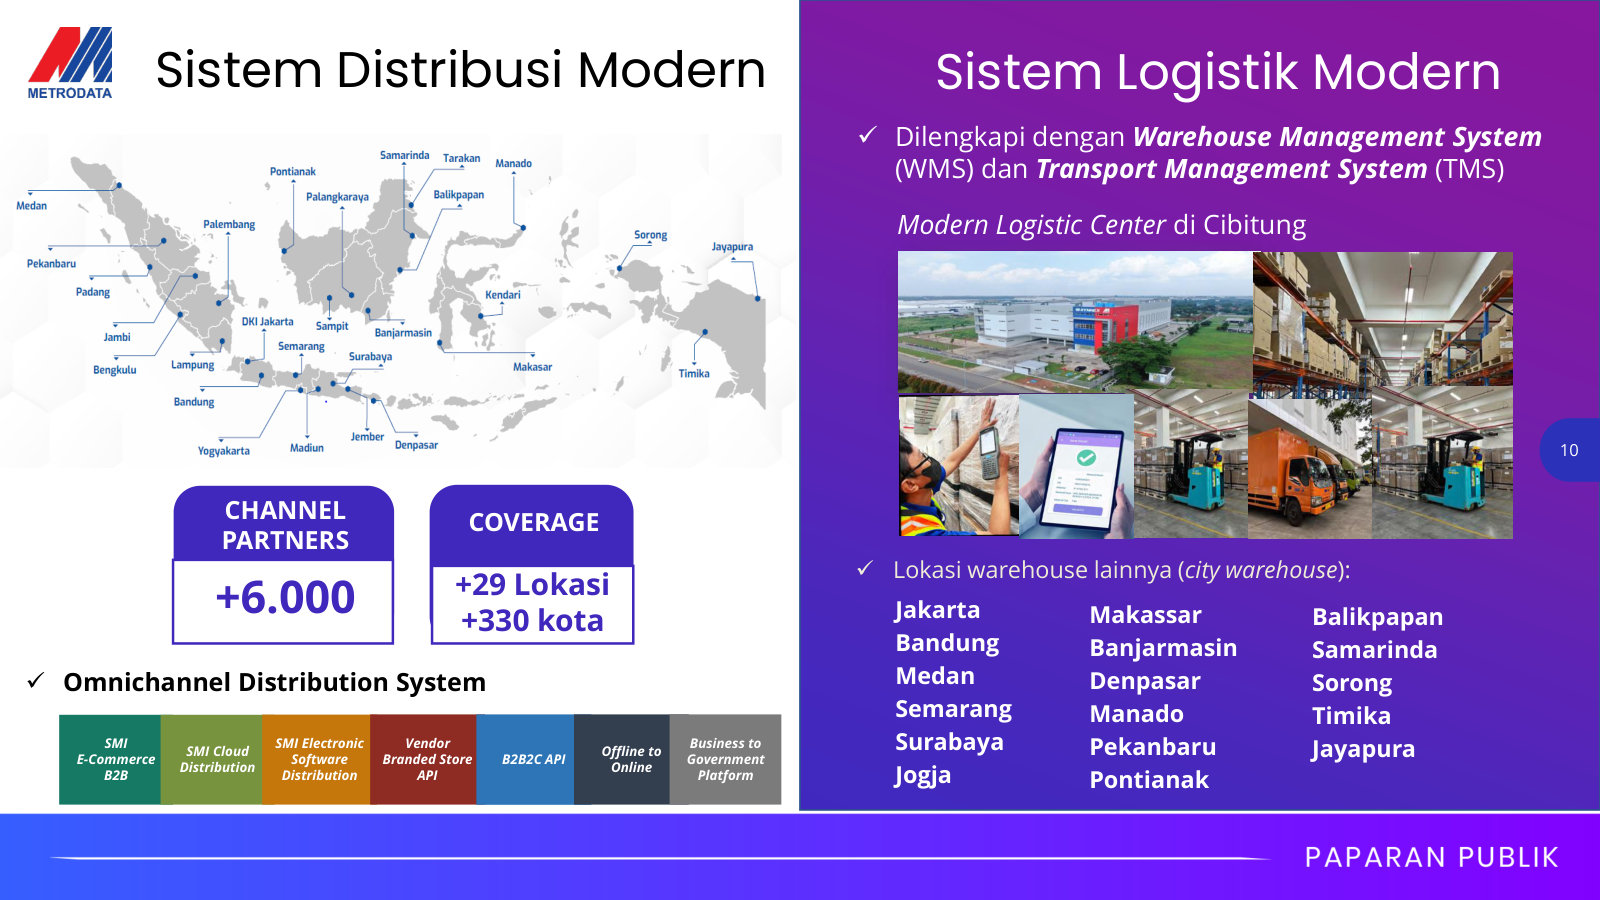
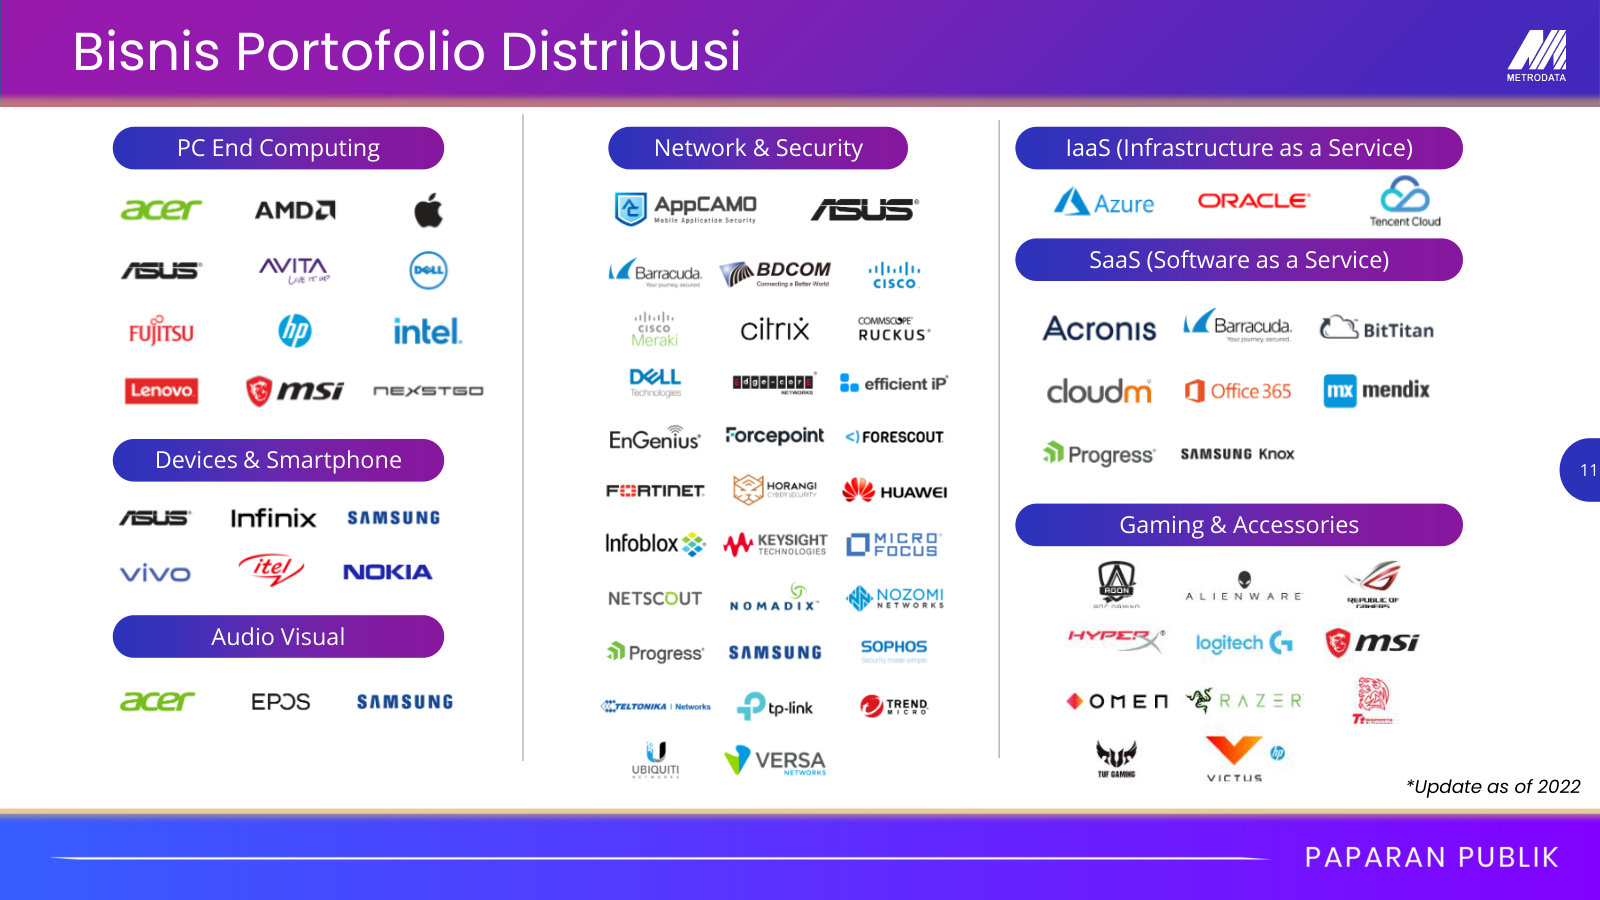
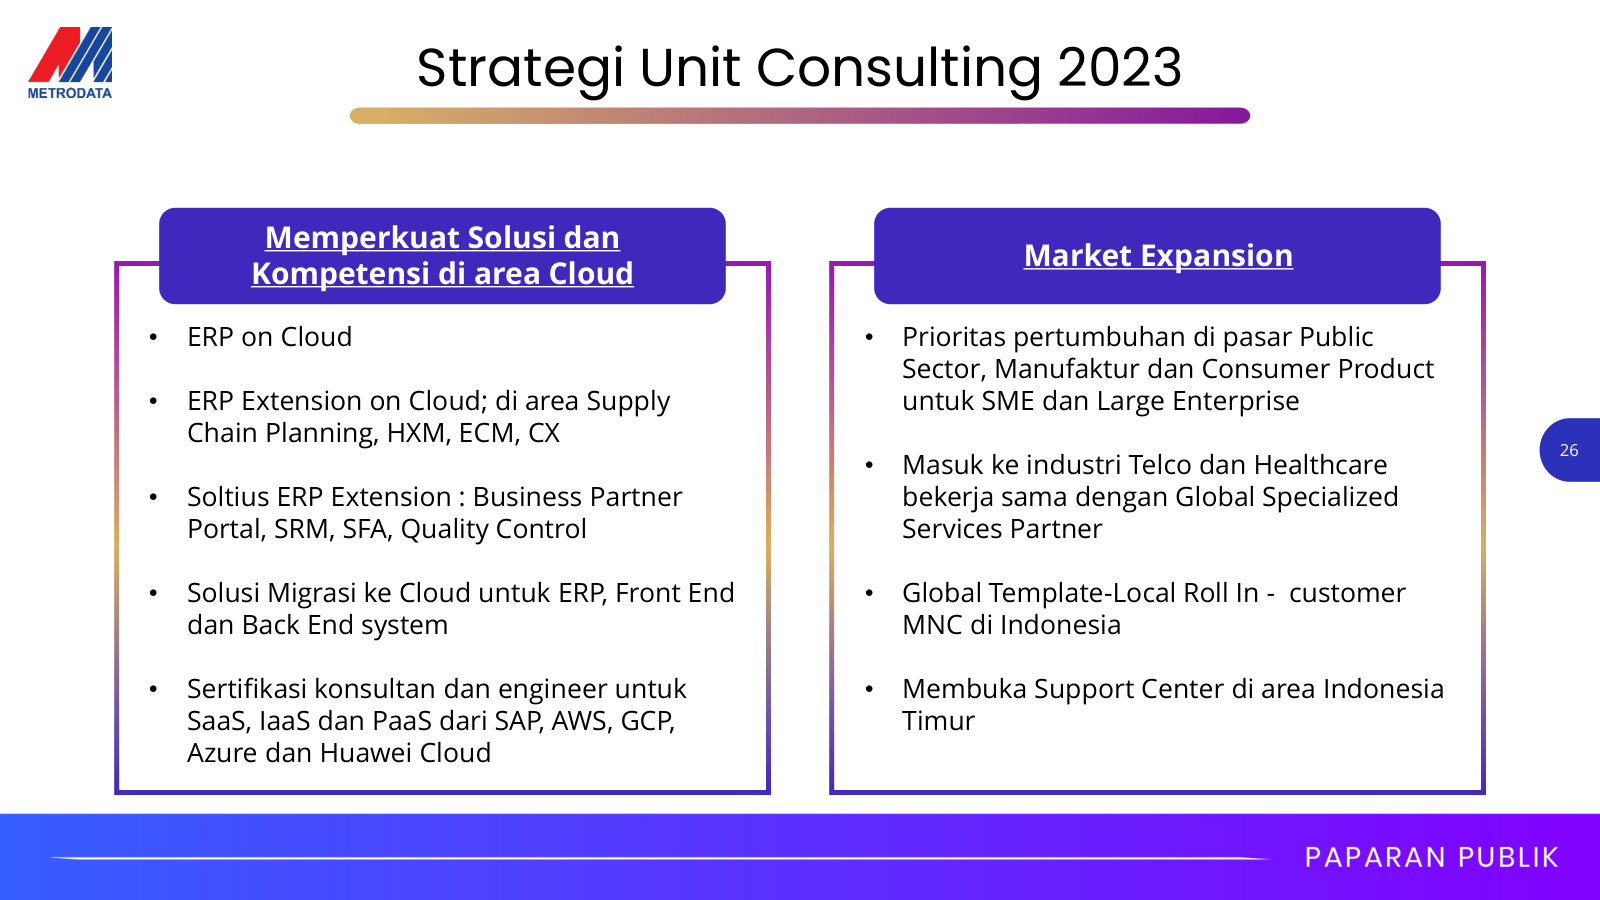
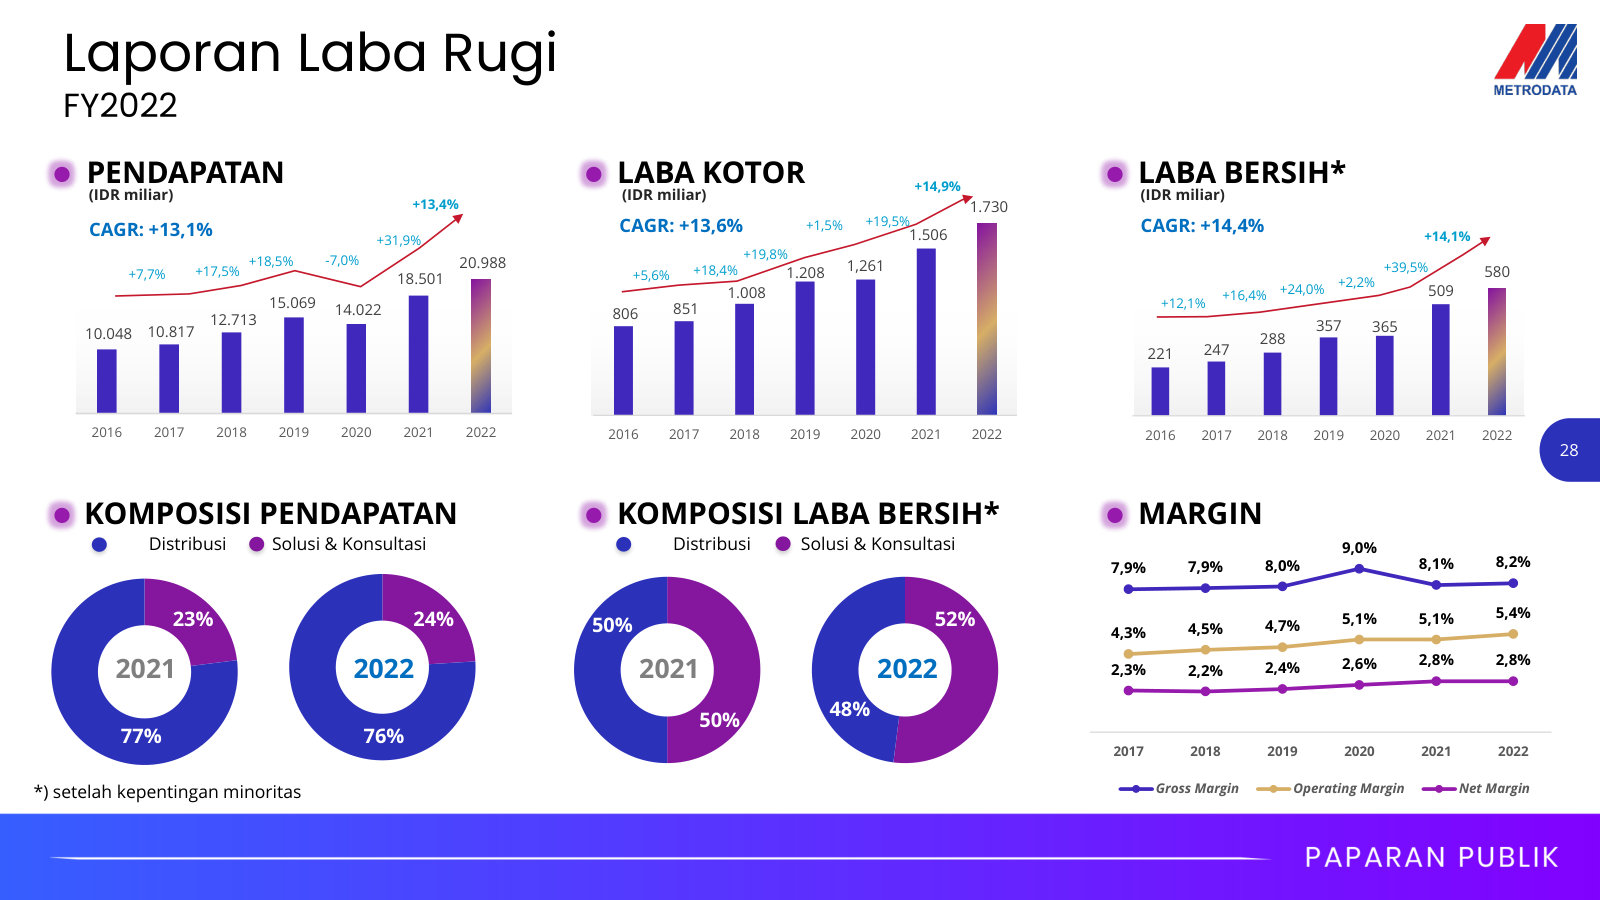
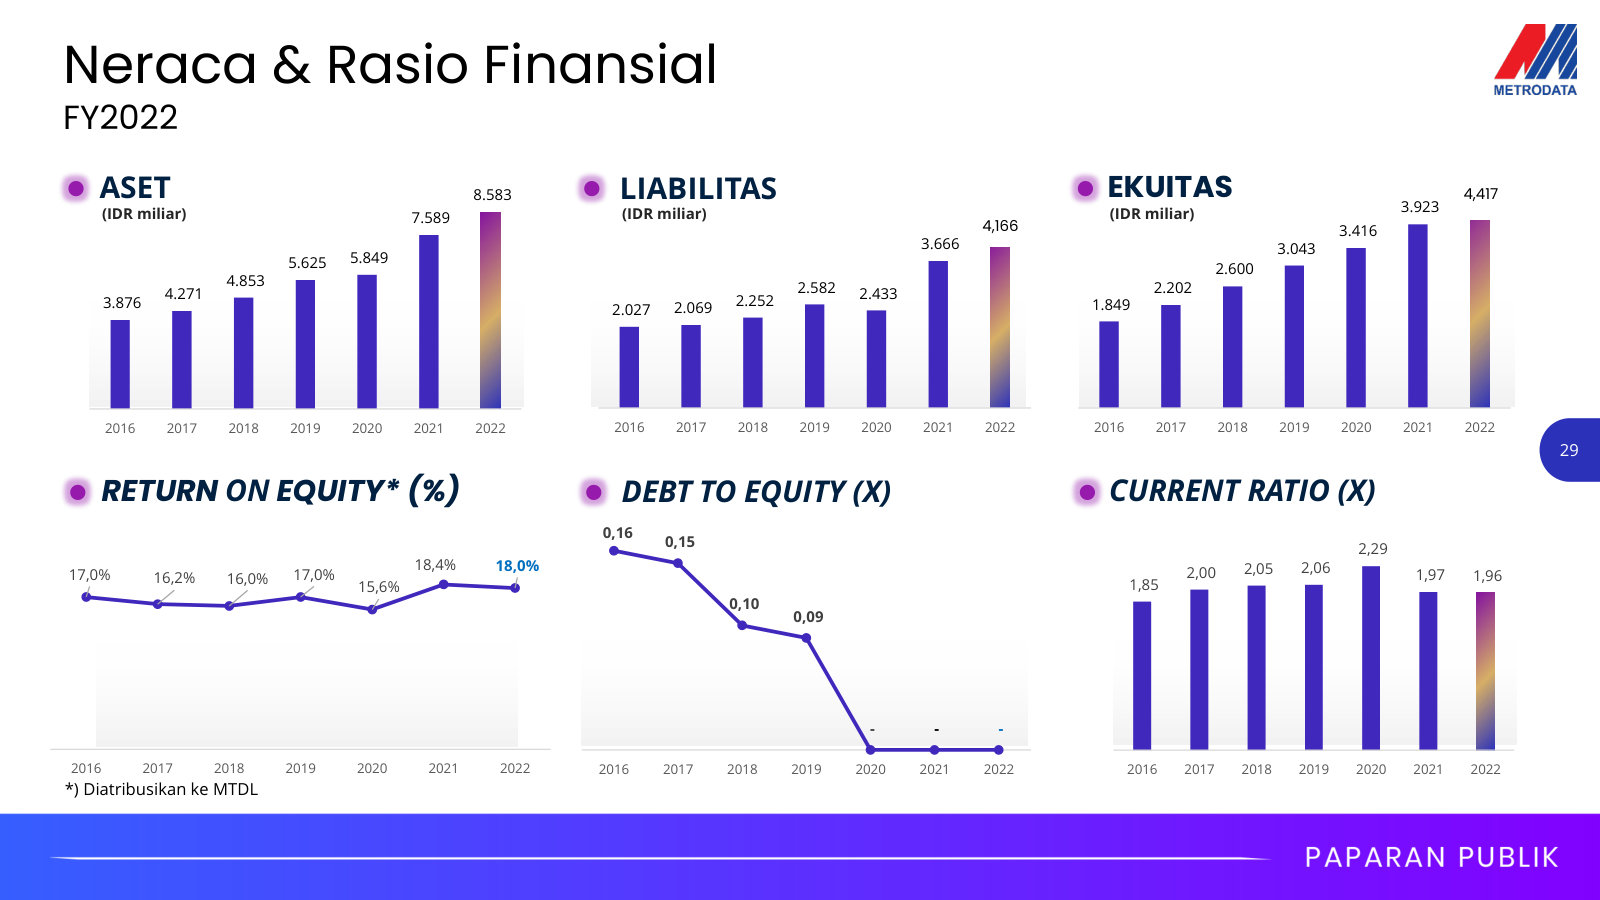
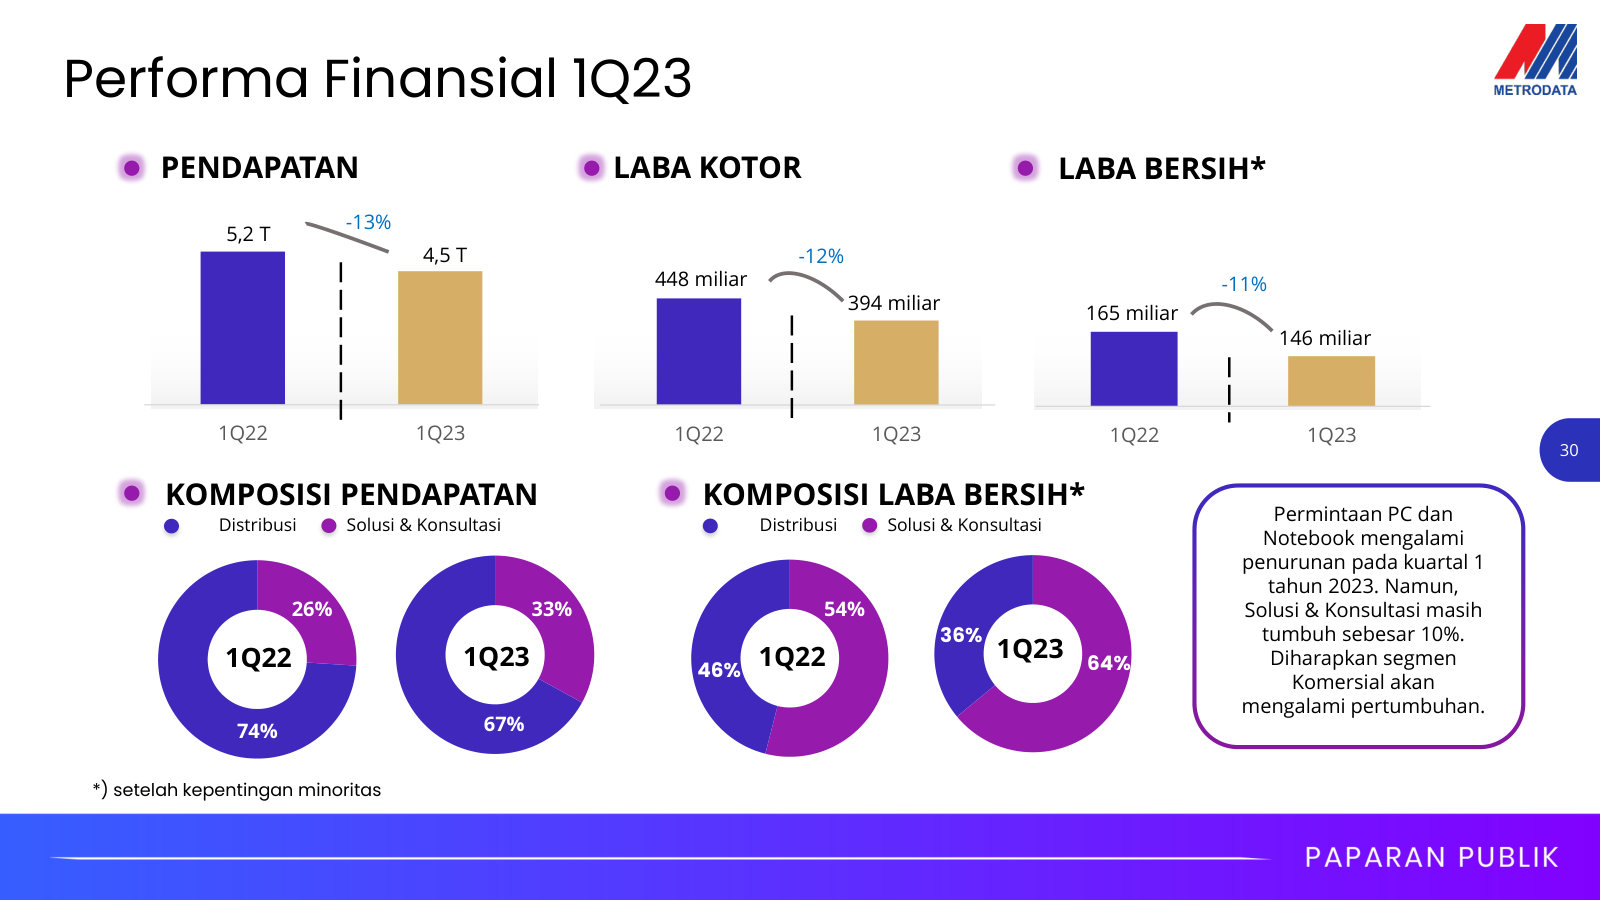
PT Metrodata Electronics Tbk's management explains the business in its own materials. The slides below do the most of that work, pulled from the documents preserved in Sources. Each source link opens the complete presentation at that slide in a new tab.
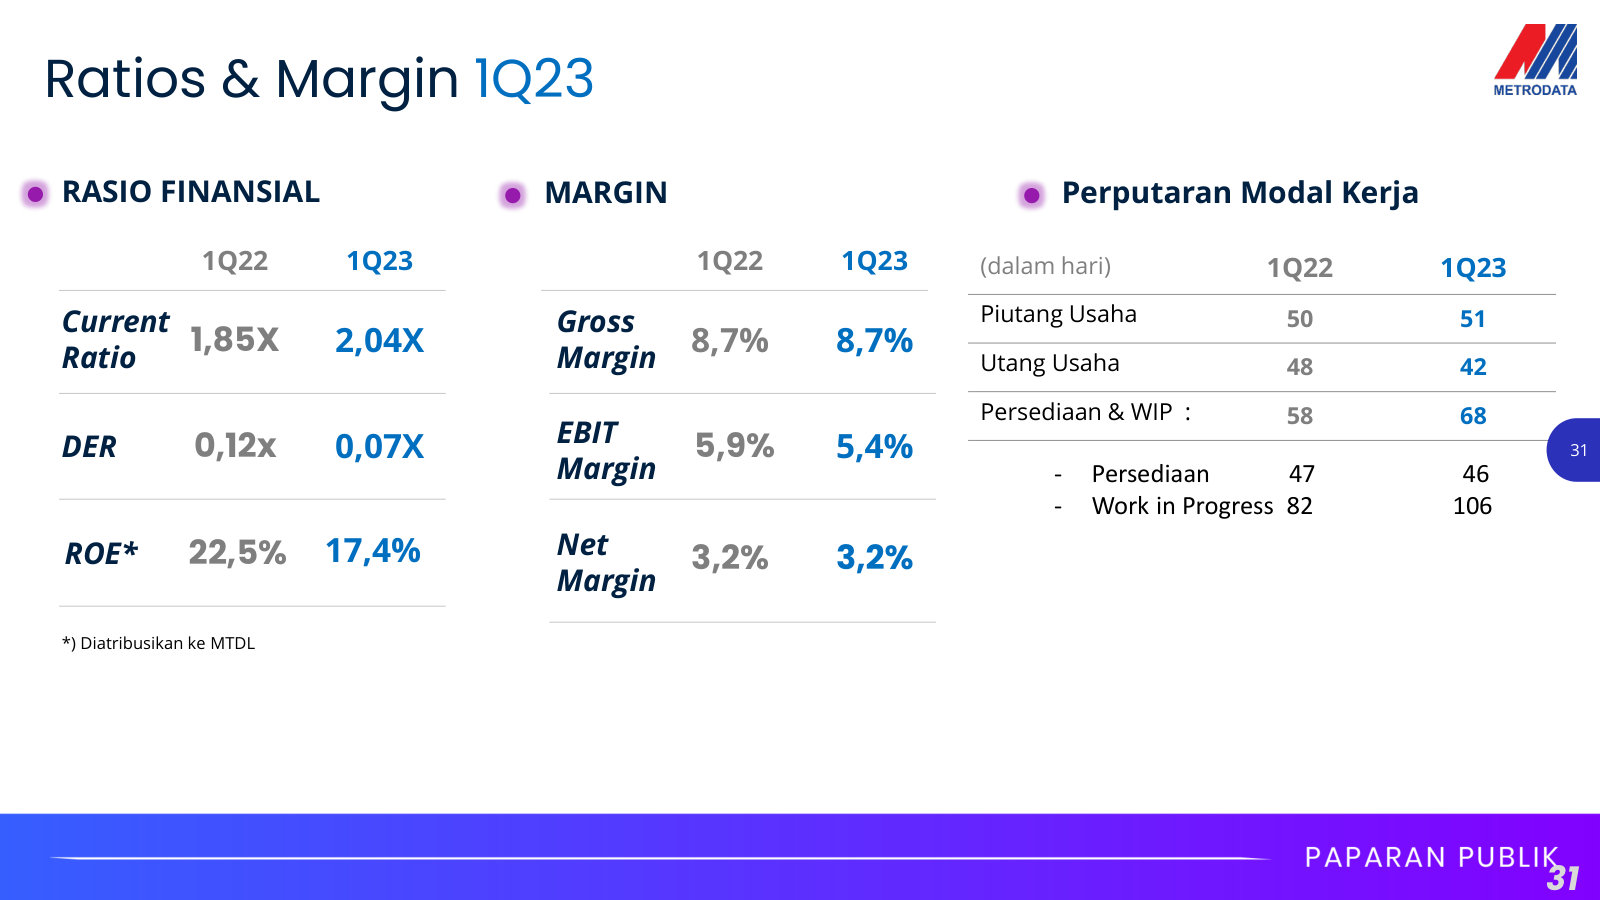
Public Expose 2023 (Paparan Publik) — 2023
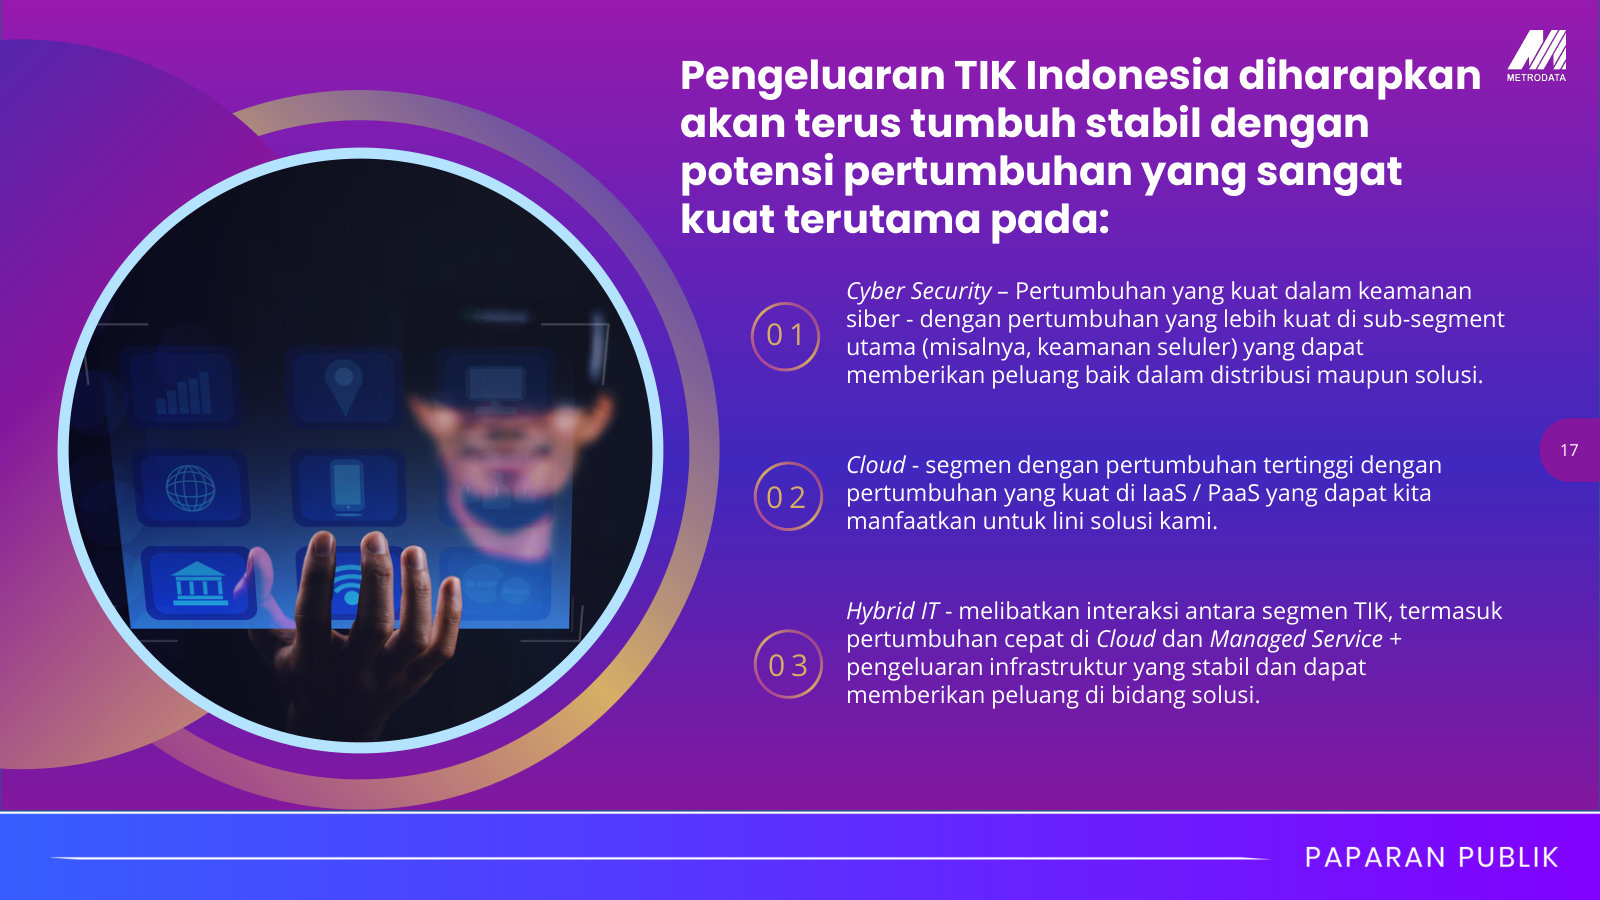
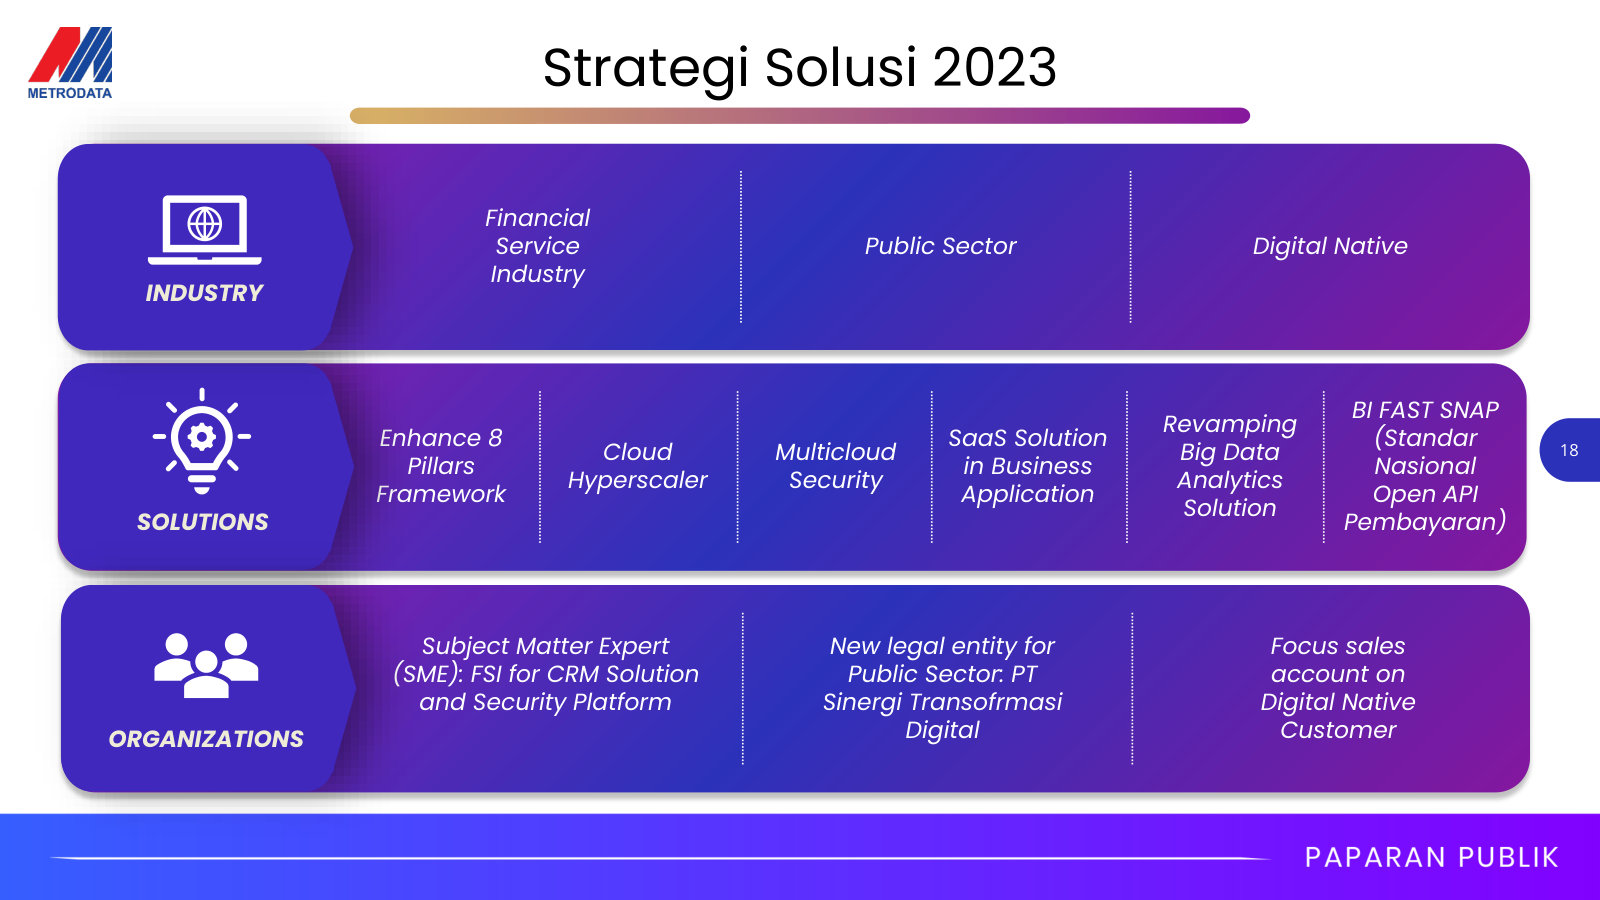
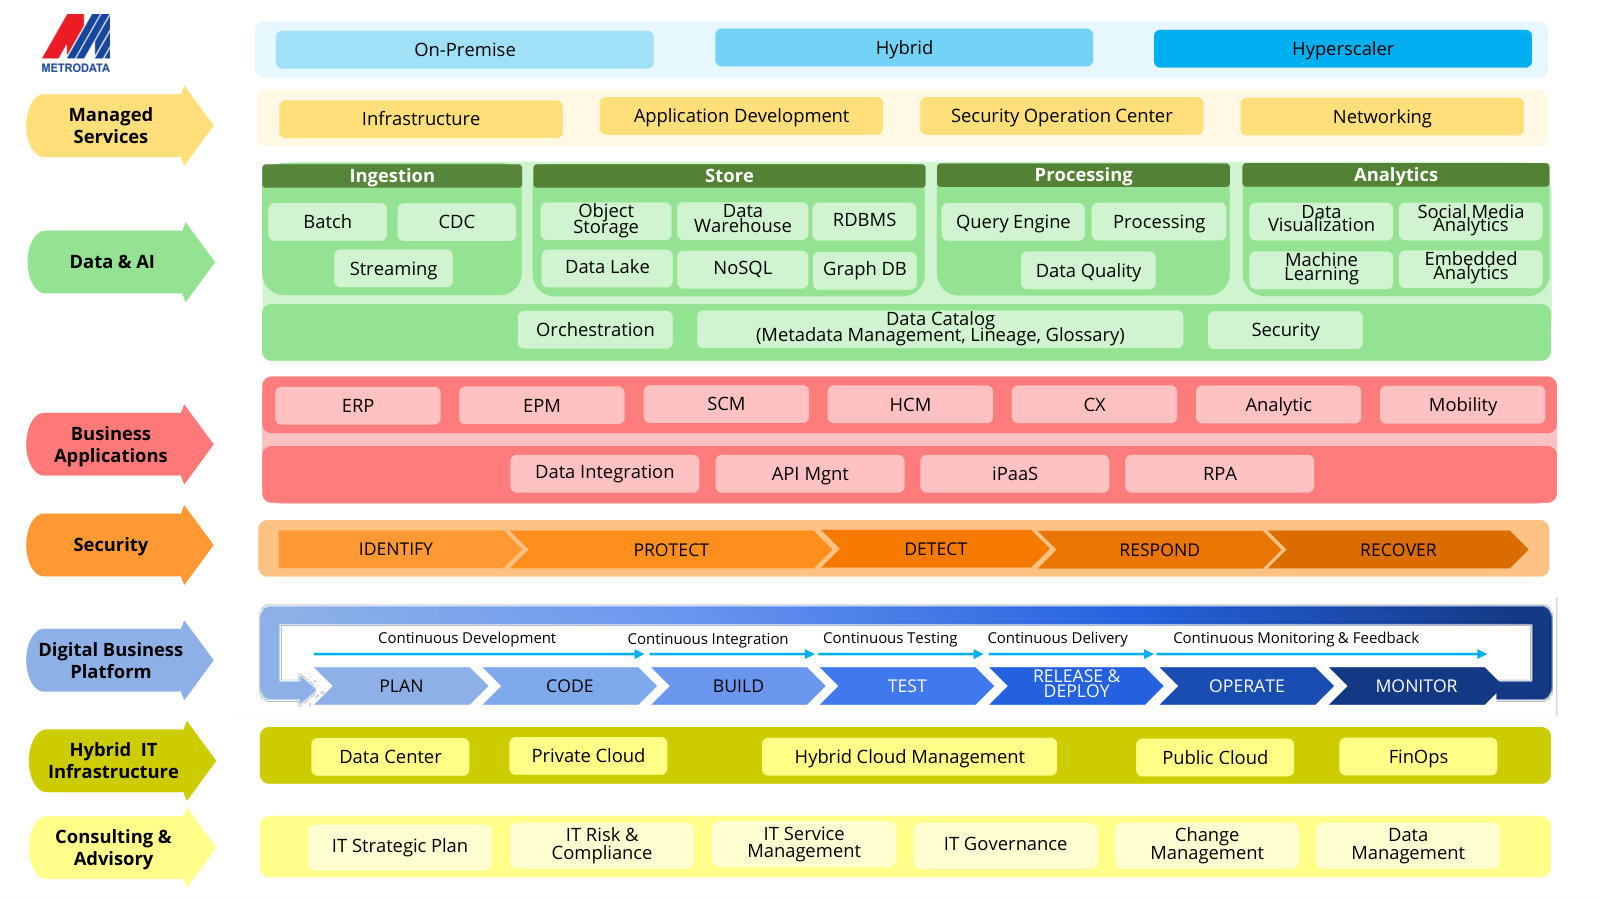
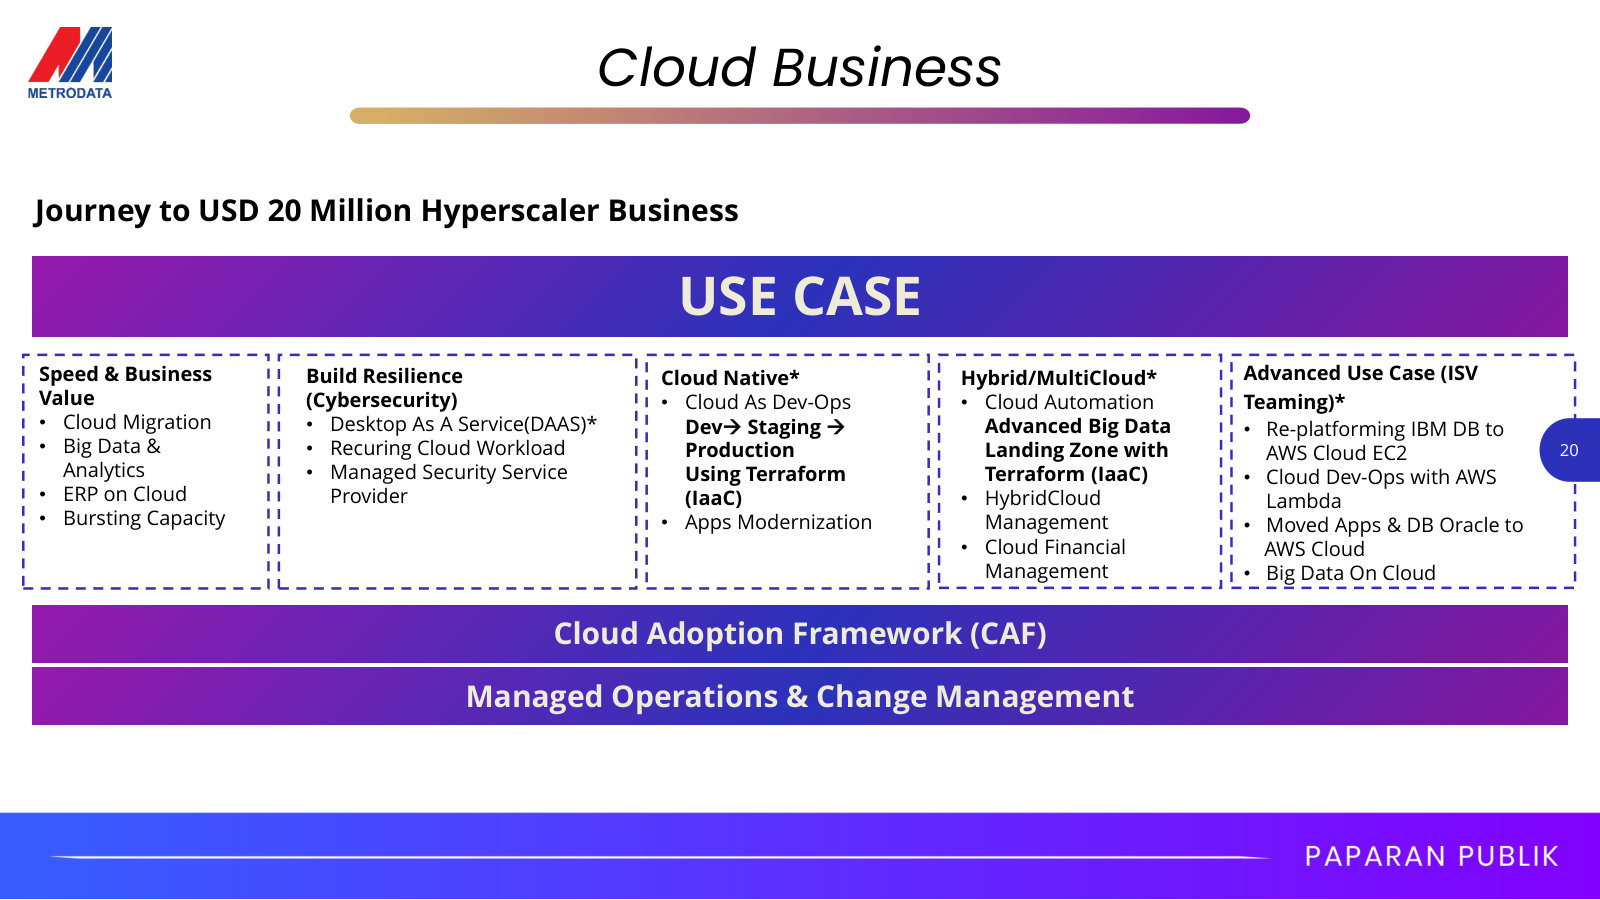
Management's fullest single explanation of the two-segment business, its strategy and its numbers — fastest way to understand Metrodata. · Open the full document →
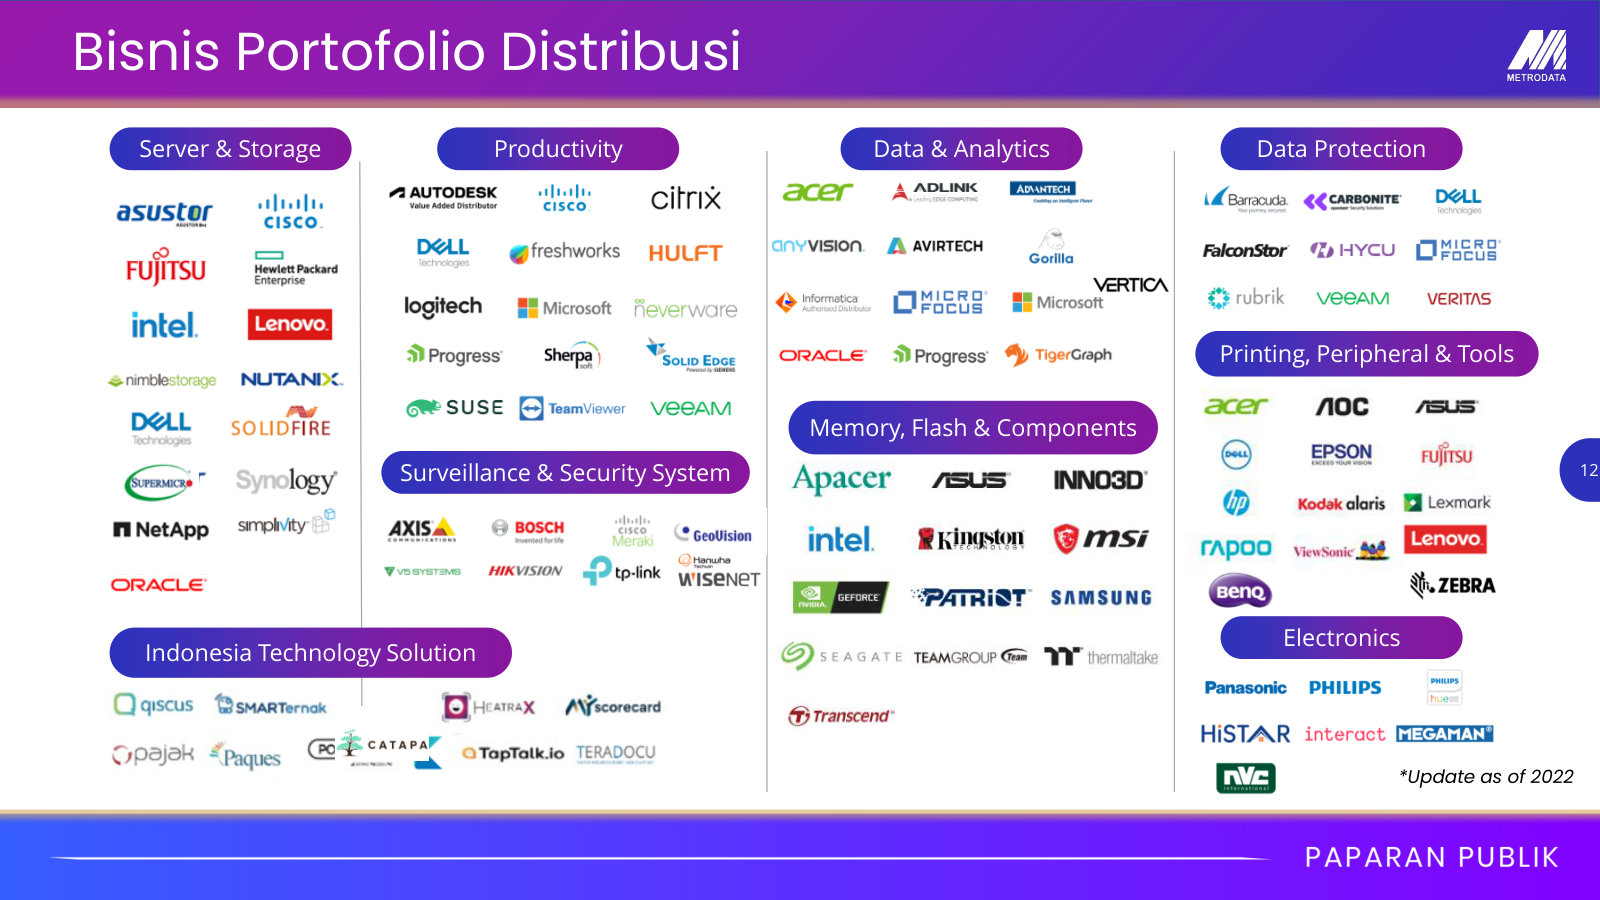
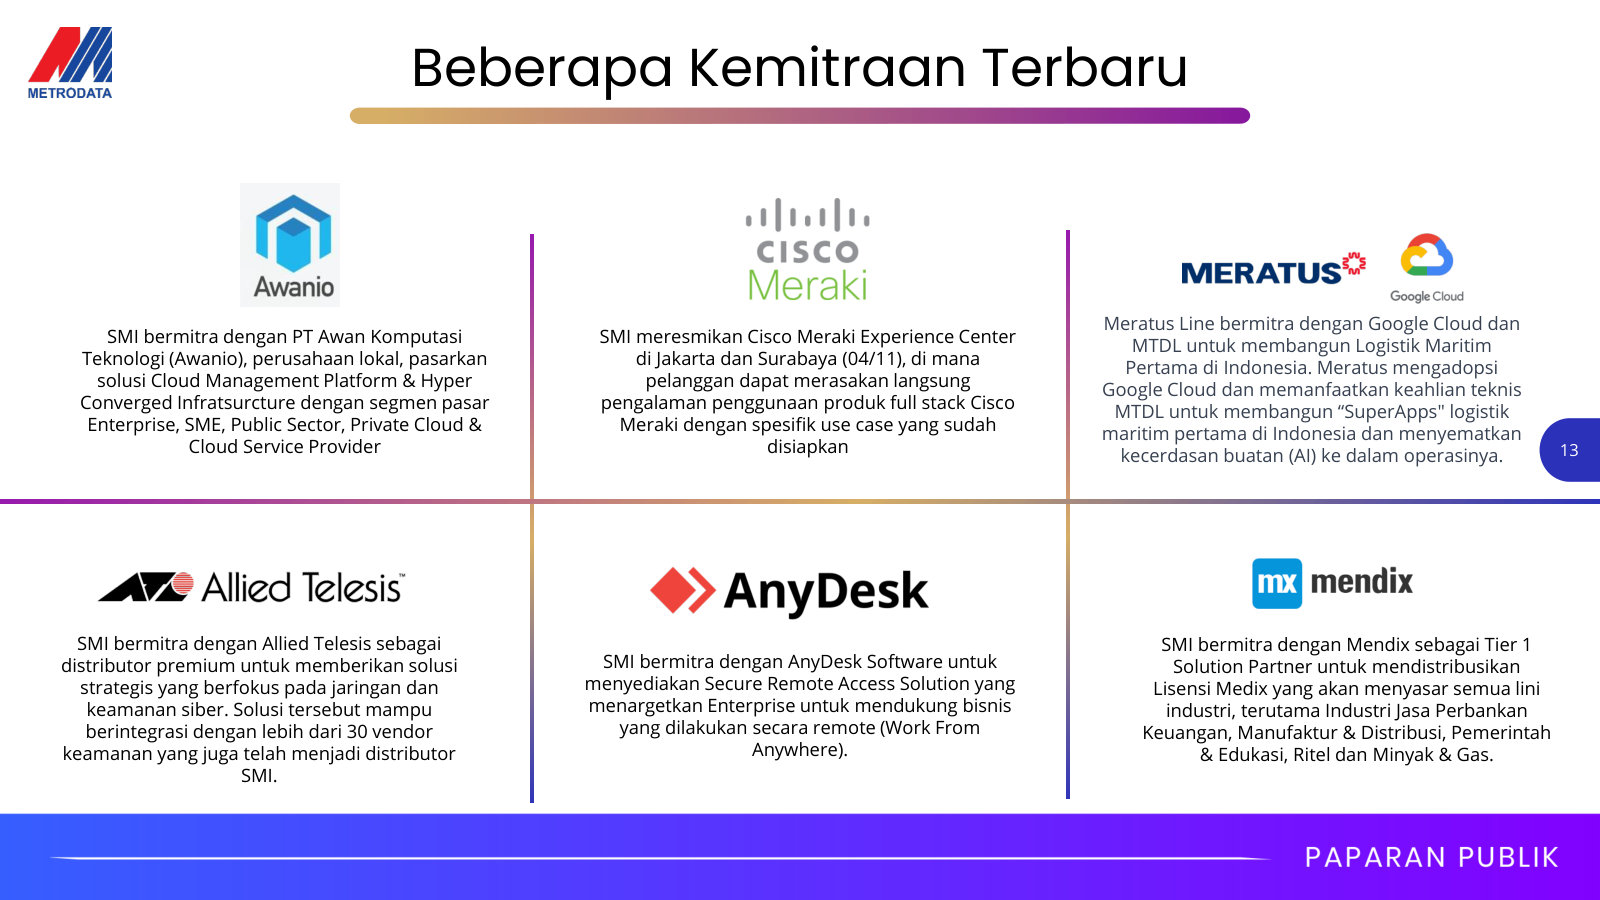
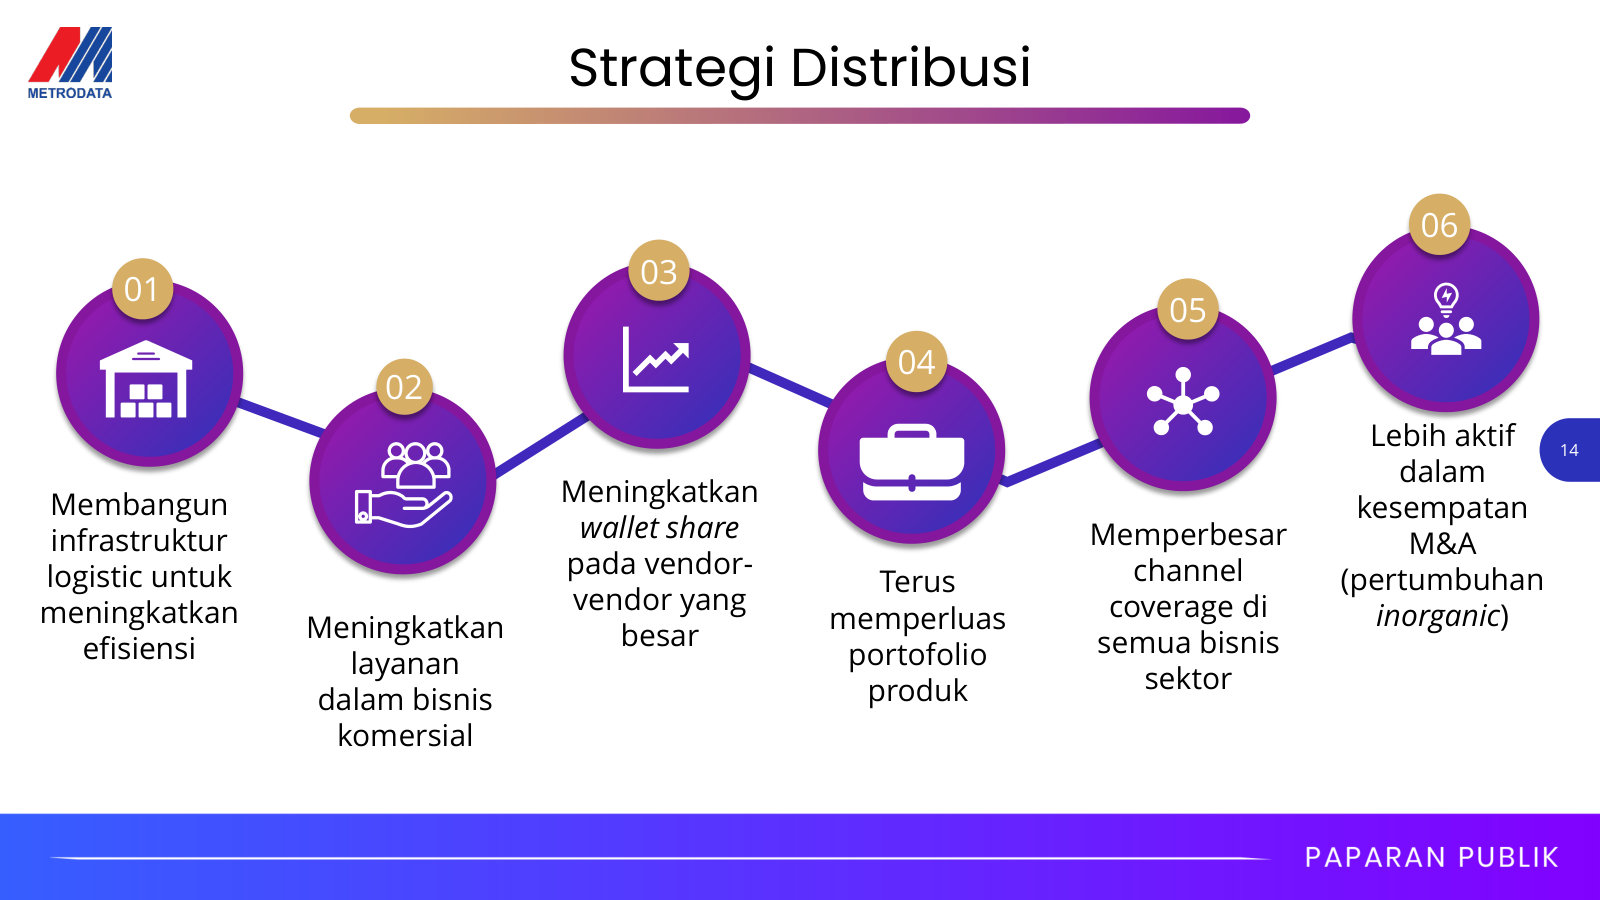
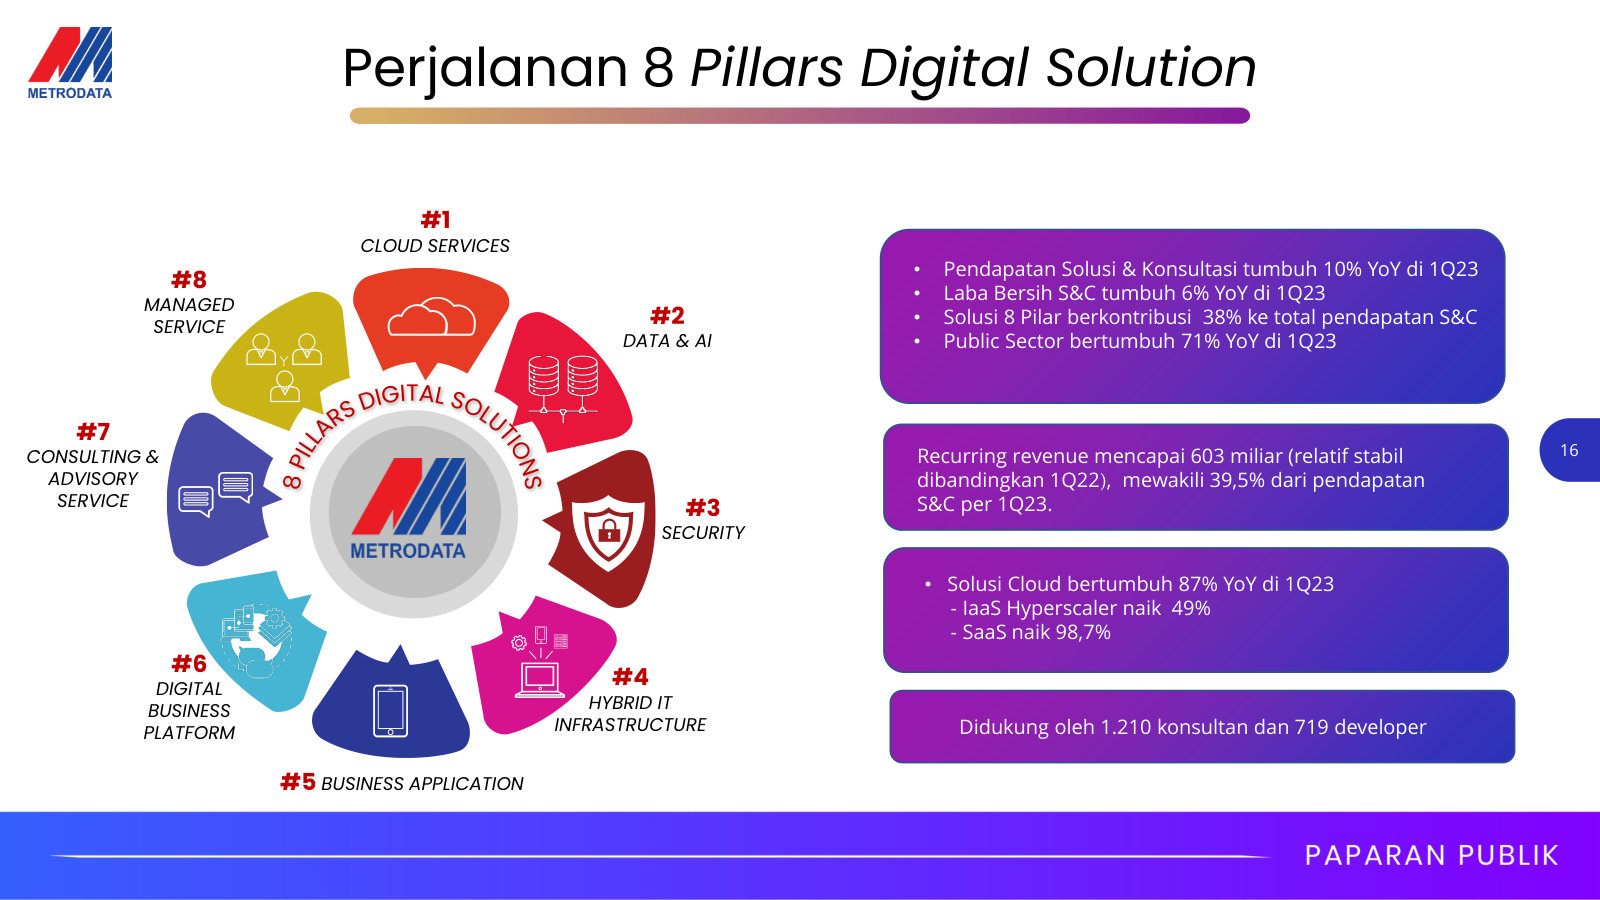
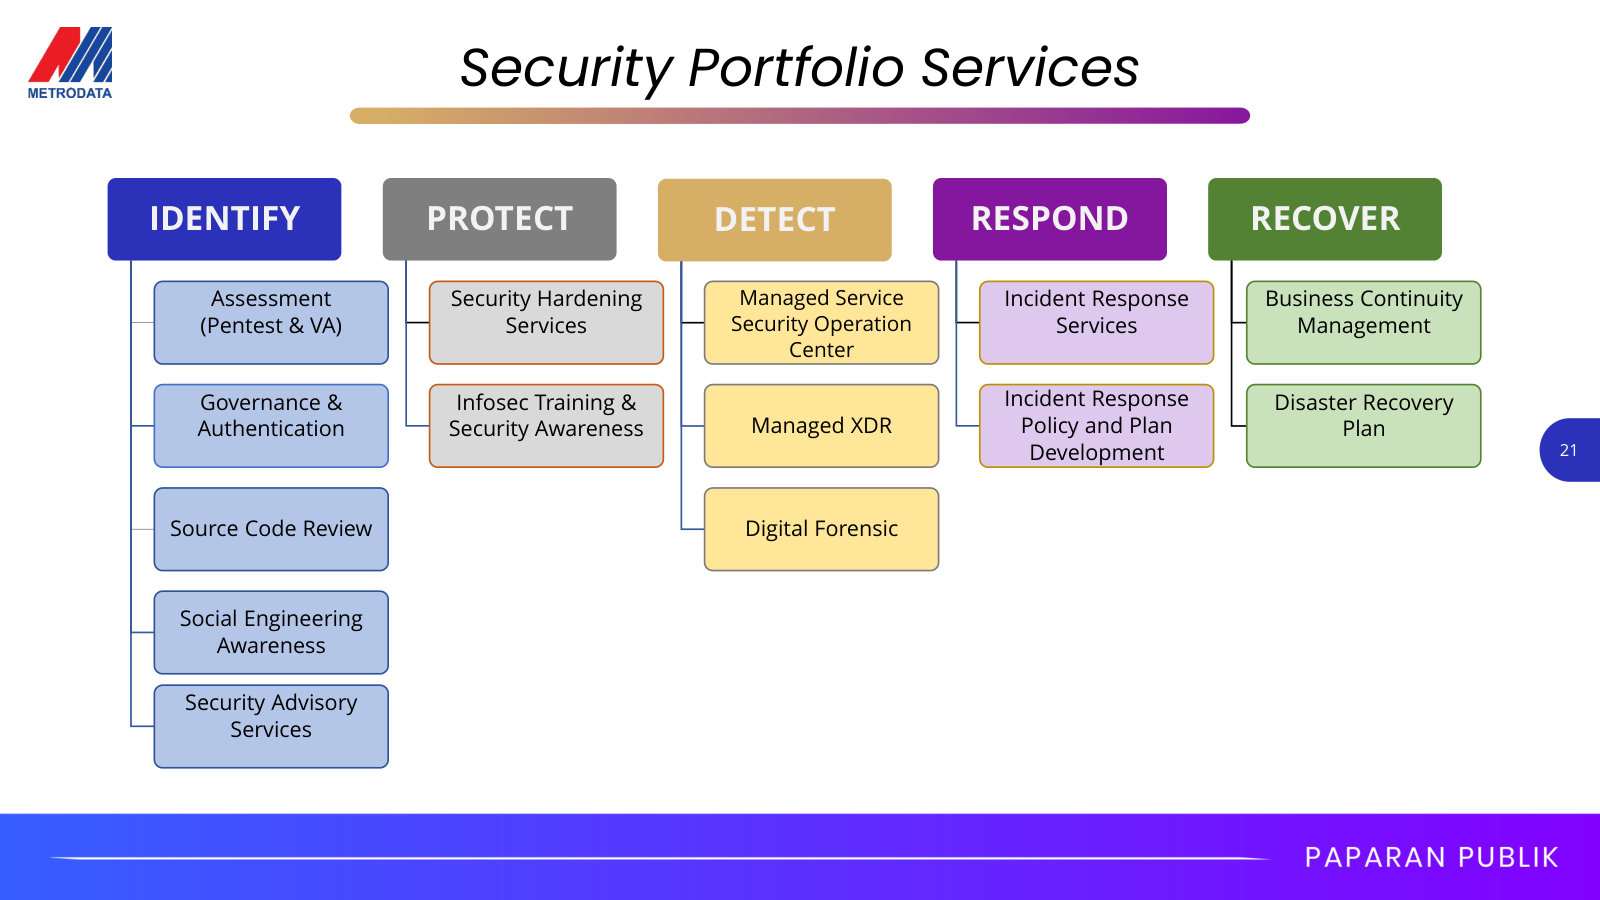
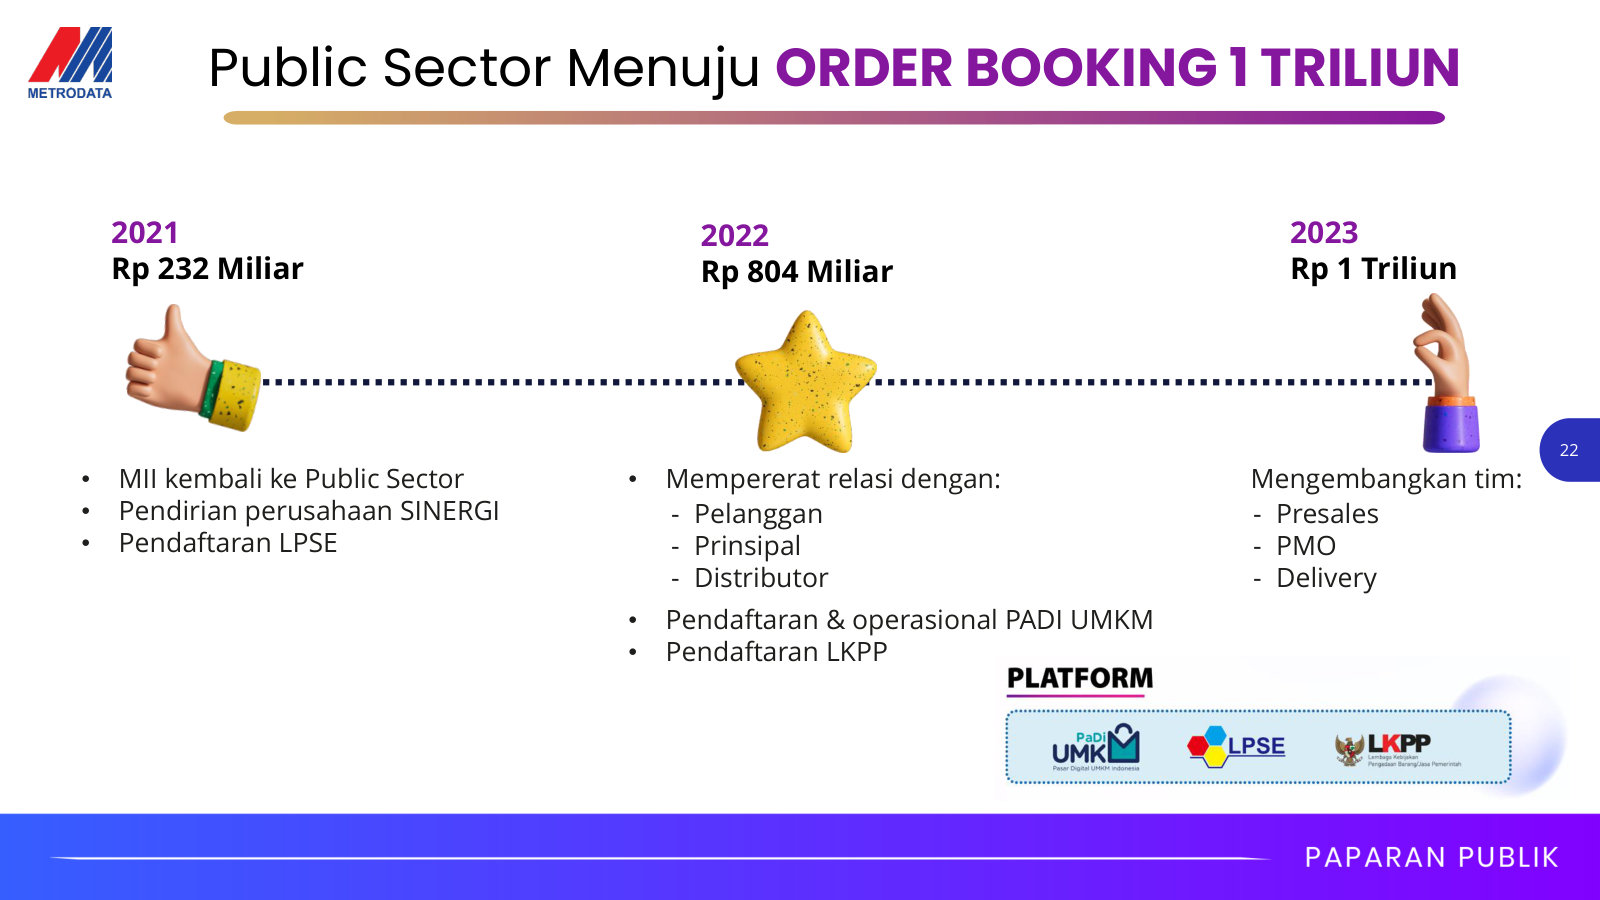
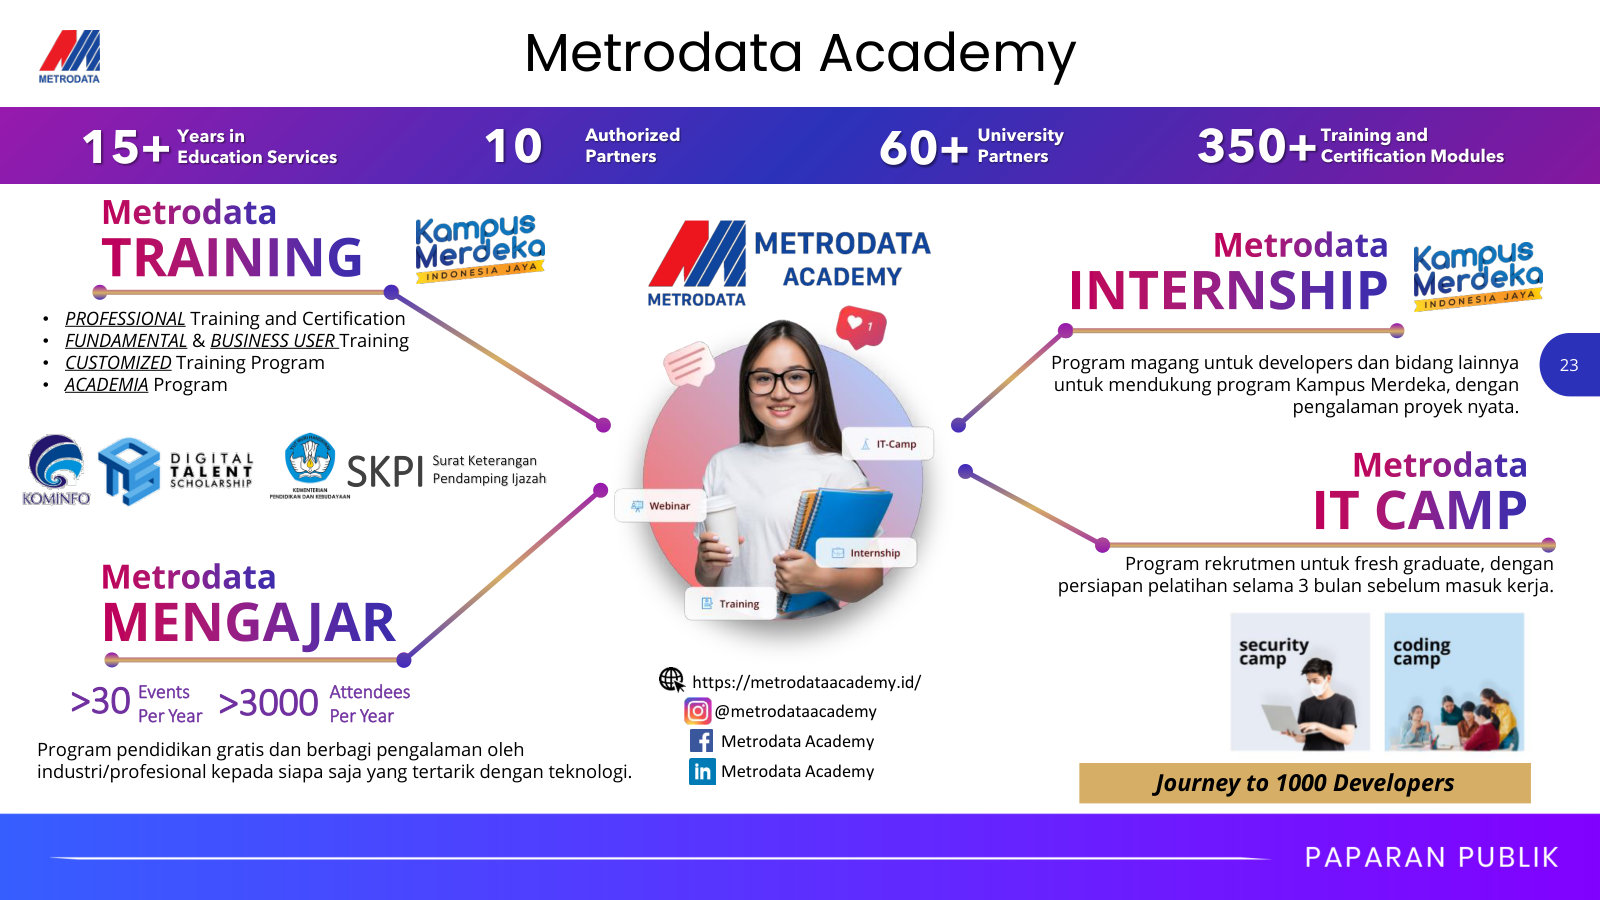
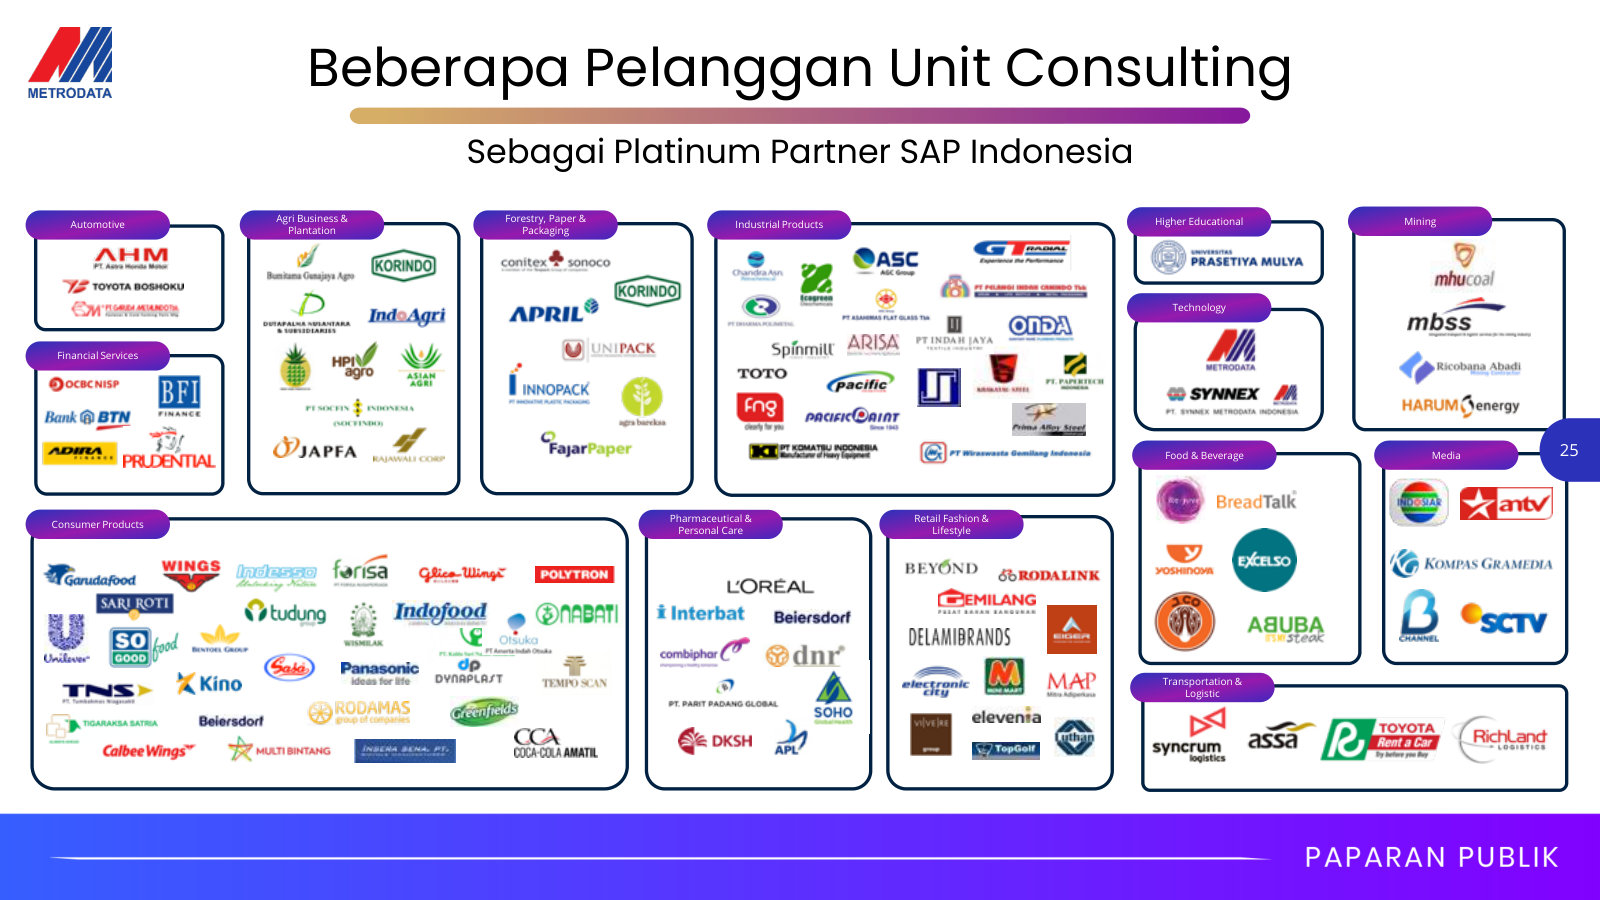
PT Metrodata Electronics Tbk's annual reports contain management's most considered account of the business. These are the sections, passages and visual pages worth opening in the originals preserved in Sources.
PT Metrodata Electronics Tbk — 2025 Annual & Sustainability Report — FY2025
The latest annual report: management's fullest account of a distributor-plus-solutions ICT group navigating weak Indonesian demand while pivoting to AI. · Open the full document →
Directors' Report — p. 18 · Read the full section →
Management's own read on the year — the AI-pioneer strategic pivot and the headline 2025 result set the frame for everything below.
2025 result: revenue Rp27.2tn (+8.1%), net profit to owners Rp814bn (+10.0%), 1.1x liabilities-to-equity.
For the 2025 financial year, the Company recorded revenue of Rp27.2 trillion, representing an 8.1% increase compared to 2024. Net profit attributable to owners of the parent entity grew by 10.0% to Rp814 billion, which translates to greater value delivered to our shareholders. The Company’s financial position remained robust, as reflected by total equity of Rp6.3 trillion and a liabilities-to-equity ratio of 1.1x, providing a solid foundation to support sustainable growth in the future.
p. 21 · Read in context →
Business Activities and Operational Areas — p. 32 · Read the full section →
The clearest statement of what the company actually is — two businesses, Eight Pillars of solutions, and 100+ distribution principals.
The two engines: Digital Solutions & Consulting (Eight Pillars) and a 100+ principal Digital Distribution network.
Currently the Company operates two main businesses, namely Digital Solutions & Consulting and Digital Distribution.
Through its Digital Solutions & Consulting business, Metrodata delivers end-to-end digital transformation services across its Eight Pillars of Digital Solutions: Cloud, Data & AI, Cybersecurity, Business Application, Digital Business Platform, Hybrid AI Infrastructure, Consulting & Advisory Services, and Managed Services. […] Metrodata’s Digital Distribution business has been solidifying its reputation as the most comprehensive ICT distributor in Indonesia. It forges collaboration with over 100 global principals. Throughout its network, the Company serves thousands of partners across hundreds of cities nationwide.
p. 33 · Read in context →
Analysis of Consolidated Statements of Profit or Loss — p. 63 · Read the full section →
Where management explains what actually moved the numbers — smartphones carried a soft consumer-hardware year.
Operational Review — p. 71 · Read the full section →
Segment-by-segment detail — the high-margin solutions unit and the volume-driven distribution unit each get their own diagnosis.
Solutions & Consulting: reactivating dormant accounts and leaning on hyperscaler partnerships for cloud growth.
The Company established dedicated teams tasked with re-mapping thousands of customer accounts considered dormant. Through these efforts, relationships with accounts that had been inactive for the past two to three years were successfully reactivated. […] To address this need, the Company leveraged its strong position as a primary partner of the three largest hyperscalers globally.
p. 72 · Read in context →
Distribution: telecom/smartphones offset a pressured consumer PC segment as the year's growth engine.
The Consumer segment faced the most monumental pressure arising from weakened demand for notebooks and PCs since the beginning of the year. […] In contrast to the weakening demand trend, the Telecommunications segment emerged as a key growth driver for the Digital Distribution Business Unit in 2025. Smartphone sales volume rose steeply, dominated by devices in the low to lower-mid price tiers, even as they came with strong specifications that gave them a competitive edge.
p. 76 · Read in context →
Risk Management — p. 114 · Read the full section →
The two risks specific to this business that could genuinely bite: scarce ICT talent and imported-hardware FX exposure.
Talent risk: growth hinges on retaining scarce ICT experts who must keep pace with fast-moving technology.
In realizing the ICT and digital business development plan, the Company relies on competent, skilled, and expert talents for its business growth. Should the Company fail to retain its executives and experts, a high turnover of employees may occur as a result. Subsequently, should the Company fail to recruit new employees as the replacements, the Company’s performance may be affected, and its revenues may be potentially reduced. […] In addition, the inability of the Company’s employees to keep abreast of the latest market developments in the ICT field may result in the Company marketing products and services that are no longer relevant or attractive to the consumers.
p. 114 · Read in context →
FX risk: much of the product slate is foreign-branded, so a stronger dollar can price demand out of the market.
Certain ICT products offered by the Company are sourced from principals in foreign countries and thus their prices are linked to certain exchange rates. Although some of the principals have set up representative offices in Indonesia and therefore are selling their products in Rupiah, changes in prices that may result from the strengthening of certain foreign currencies may result in a decline in the demand for these products.
p. 115 · Read in context →
Note 2r — Revenue and Expense Recognition — p. 210 · Read the full section →
The accounting policy that defines the model: when Metrodata books gross (principal) versus net (agent) revenue.
Principal vs. agent: third-party/cloud licenses booked net as agent; otherwise revenue is gross as principal.
In arrangements with customers where software licenses are delivered entirely by third party, or where the updates and cloud access are critical and there are no material onpremise components in satisfying its performance obligation, the Group will recognise revenue on a net basis as the Group is acting as an agent in the transaction. In all other cases, the Group is deemed to be acting as principal and revenue is recognised on a gross basis.
p. 210 · Read in context →
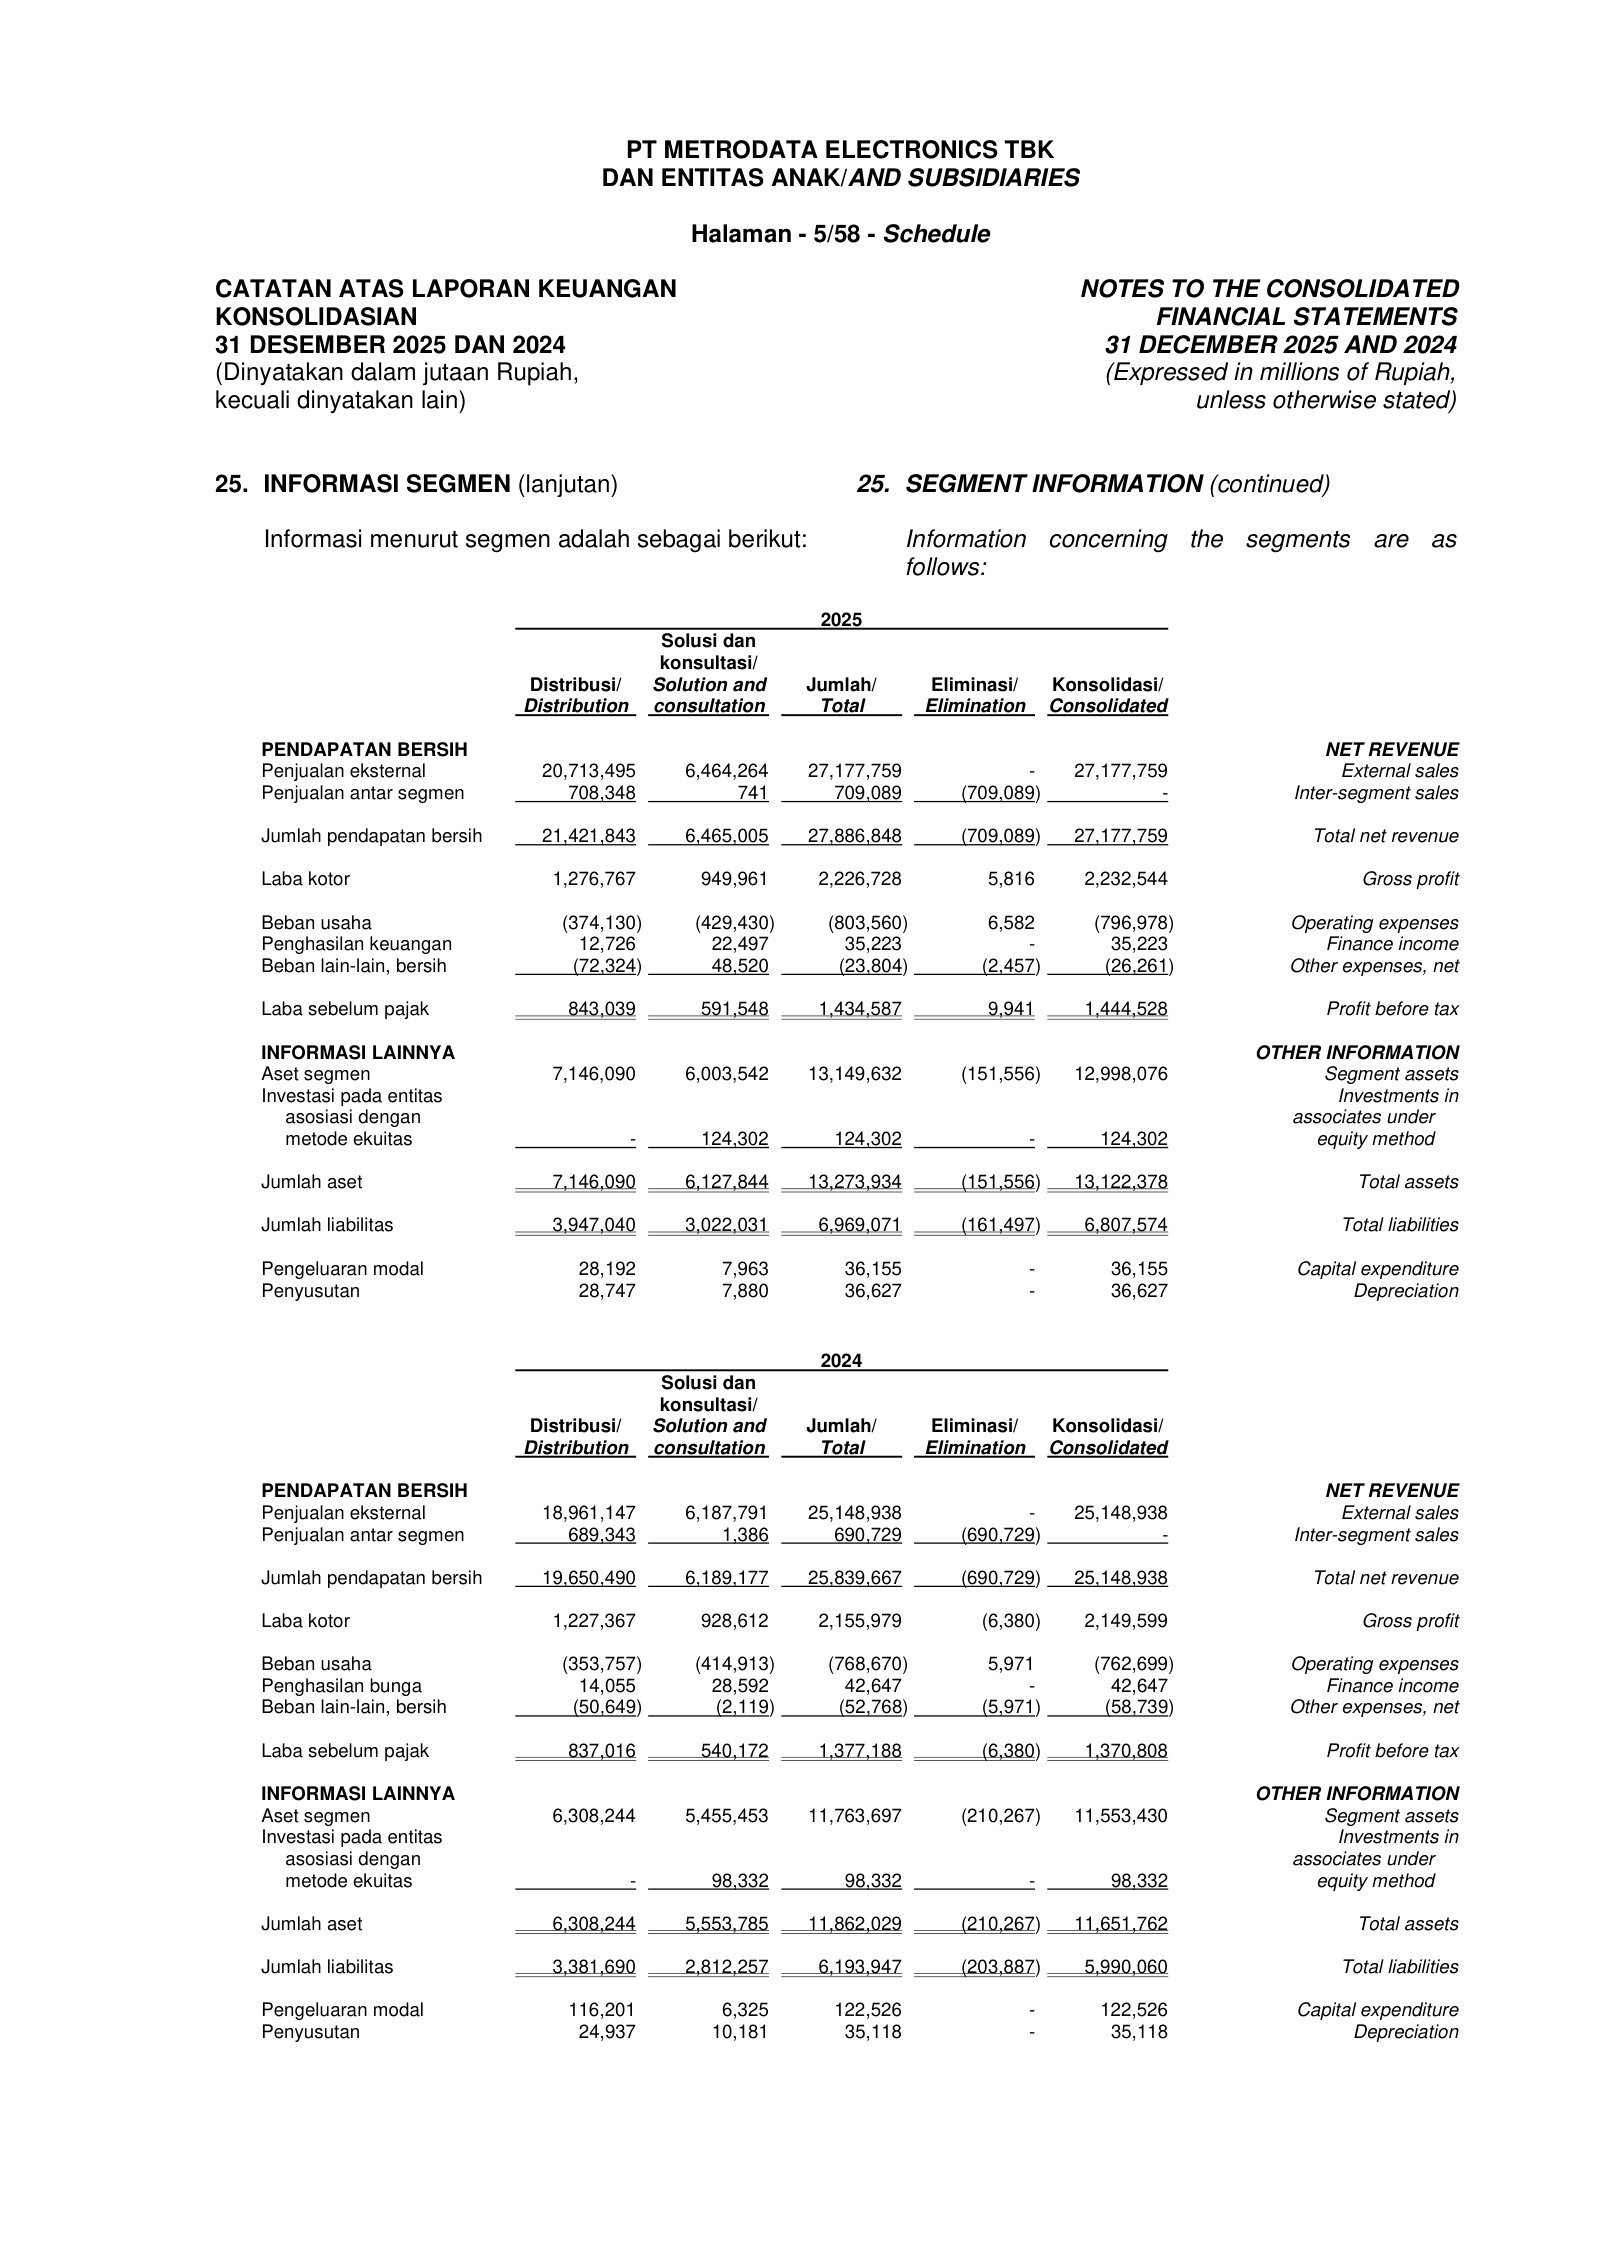
Note 25 — Segment Information — p. 243 · Read the full section →
The whole business model in one table: high-volume/thin-margin Distribution against smaller/richer-margin Solutions.
More annual reports
PT Metrodata Electronics Tbk — 2024 Annual & Sustainability Report — FY2024 · 263 pages · Prior-year edition: the +13.9% revenue and +15.9% operating-income growth that 2025's softer print is measured against. · Open →
PT Metrodata Electronics Tbk — 2023 Annual & Sustainability Report — FY2023 · 255 pages · Two years back, pre-AI-pioneer framing — useful baseline for the same two-segment structure and Eight Pillars. · Open →
Competitors describe PT Metrodata Electronics Tbk's market in their own filings and calls. These verified passages and visual pages show where their strategies meet, using source documents preserved in Sources.
PT Astra Graphia Tbk (ASGR)
The closest listed Indonesian analogue to Metrodata's technology business. Through its 99.99%-owned subsidiary PT Astra Graphia Information Technology (AGIT), Astragraphia resells hardware and software and delivers IT services — managed services, cloud, cybersecurity and infrastructure — the same product-distribution-plus-solutions model that defines Metrodata's two segments (Distribution and Solution & Consultation). Astragraphia's other leg is Fujifilm document and printing solutions, which does not overlap; the exhibits below are drawn only from its IT-solutions business.
How Astragraphia describes its competing IT arm, AGIT: hardware and software sales plus implementation, managed, operations and infrastructure services. This is the same scope as Metrodata's Distribution and Solution & Consultation segments, placing the two in direct overlap in Indonesian enterprise IT. (OCR renders "offers" as "ofers".)
The Information Technology Solutions Portfolio, through its subsidiary PT Astra Graphia Information Technology (AGIT), ofers IT-based business solutions that include hardware sales, software, and implementation services (IT services). Specifically, AGIT's IT Services include Business Application Services, IT Managed Services, IT Operation Services, and Infrastructure Services (EFH). In developing its services, AGIT collaborates with world-class strategic partners.
p. 94 · Read in context →
Astragraphia sizes its competing IT arm: AGIT booked FY2025 net revenue of Rp1,653 billion with 39% profit growth, and is pushing into cybersecurity and cloud. On this disclosure the overlap with Metrodata is real but far smaller in scale — AGIT's revenue is under a tenth of Metrodata's roughly Rp27 trillion FY2025 consolidated revenue.
To improve its position in the IT services market, AGIT also continues to develop new services in cybersecurity and cloud computing. In 2025, AGIT reported a net revenue of Rp1,653 billion and a net profit of Rp66 billion, representing a 39% growth compared to 2024.
p. 95 · Read in context →
Astragraphia's read on the shared market, citing IDC: Indonesian corporate IT spending growing about 13% in 2026, led by cloud, cybersecurity and managed services — the same demand pool Metrodata's Solution & Consultation segment targets.
The information technology sector in Indonesia is projected to see a 13% increase in total corporate spending by 2026, according to International Data Corporation (IDC). This rise is driven by significant investments in IT infrastructure, hardware, software, and services, as both companies and the government accelerate their digital transformation initiatives. […] The rapid digital transformation across various industries creates a substantial business opportunity, especially in managed IT services. Growth is expected to be primarily fueled by cloud computing, cybersecurity, and advanced IT solutions.
p. 96 · Read in context →
More peer documents
Astragraphia FY2024 Annual Report — prior-year IDC market read (p.45) — FY2024 AR · 308 pages · One-year-earlier IDC citation projecting Indonesian enterprise IT spending up 12% in 2025; pairing it with the FY2025 report shows the market-growth assumption Astragraphia and Metrodata both plan against. · Open →
Source: S&P Capital IQ consensus via Xpressfeed · Generated 2026-07-27.
Coverage is one-analyst-deep with no revenue, momentum, or beat history
Every estimate here comes from a single analyst, and the feed carries no revenue, EBITDA, margin, or cash-flow line. The momentum, quarterly, and beat/miss records are all empty, so revision direction and guidance behavior cannot be assessed.
Forward estimates
Currency: IDR · Scale: money in absolute · YoY uses the prior fiscal year from the feed; analyst count and range use the first displayed period.
| Metric | FY2025A | FY2026E | YoY | Analysts | Low / high |
|---|---|---|---|---|---|
| EPS (normalized) | IDR 64.70 | IDR 72.30 | — | 1 | IDR 64.70 / IDR 64.70 |
Recommendation skew is fully positive on a lone Rp800 target
The rating mix carries more names than the numeric estimates, but the price target rests on a single submission, so there is no spread to read.
Currency: IDR · Scale: money in absolute · Analyst counts shown explicitly.
| Street view | Reading | Analysts |
|---|---|---|
| Recommendation mix | Buy 2, Outperform 1, Hold 0, Underperform 0, Sell 0 | 3 |
| Consensus score | 1.33 | 3 |
| Target price | mean IDR 800.0; median IDR 800.0; high IDR 800.0; low IDR 800.0 | 1 |
Metrodata Electronics is Indonesia's largest listed technology distributor and IT-solutions group: roughly Rp 27 trillion of revenue, earnings that have risen every year since 2019, controlled by the Ciputra family, and financed almost entirely by working capital rather than debt. Yet the shares trade at about book value and under eight times earnings, some 40% below their early-2022 peak, even as profit has grown ~60% over the same window. This report exists to work out which of those two facts is the mistake.
What the company is
Metrodata runs two businesses under one listed holding company [1]. ICT Distribution — moving hardware, software, storage and peripherals from global principals to a national dealer network — is the scale engine. Solution & Consultation — cloud, cybersecurity, data and AI, and SAP-based business transformation delivered by subsidiaries such as Mitra Integrasi Informatika — is the smaller, higher-margin engine.
The economics of the two are very different, and the group's headline margins are an average of them. In FY2025, Distribution booked Rp 20.7 trillion of external sales but only Rp 1.28 trillion of gross profit — a 6% gross margin — while Solution & Consultation turned Rp 6.5 trillion of sales into Rp 0.95 trillion of gross profit, a ~15% margin [2]. So a segment that is under a quarter of revenue produces well over a third of gross profit and pre-tax profit. This mix — a thin, high-volume distribution book carrying a richer solutions layer — is the shape of the whole business.
Source: FY2025 Annual Report, Note 25 Segment Information — external sales, gross profit and profit before tax by segment [3].
A record of steady growth
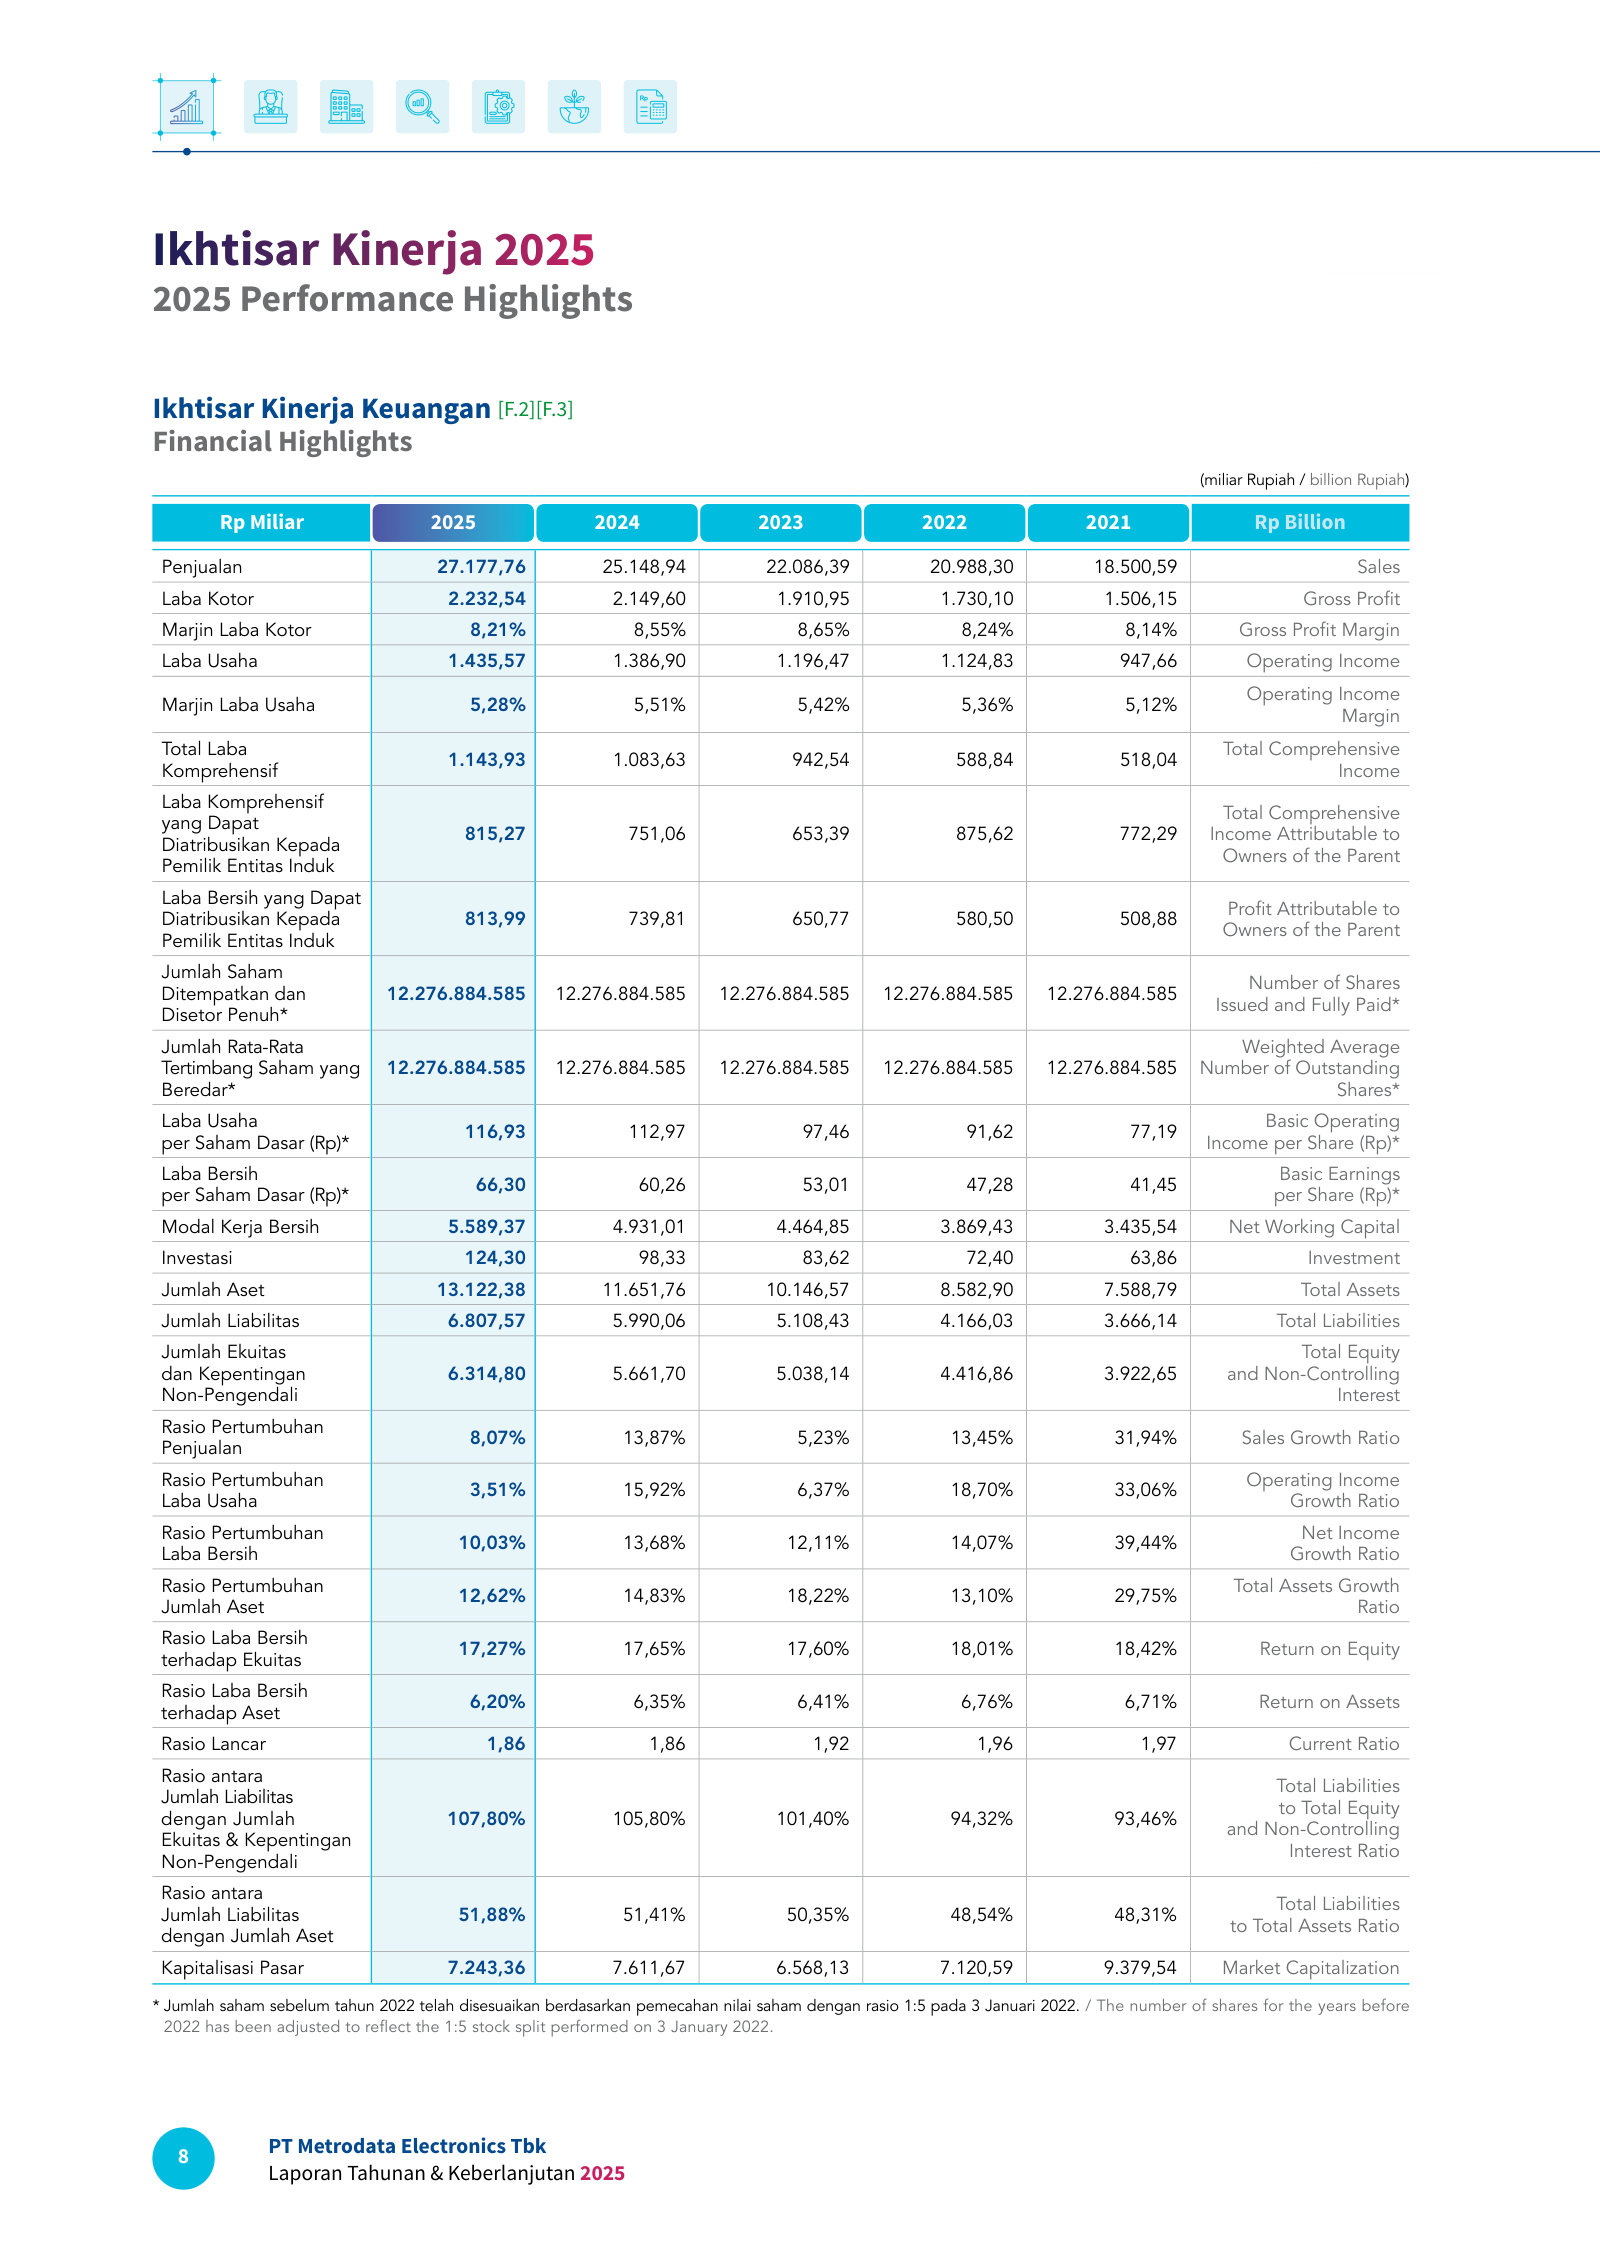
For a company the market treats as a value trap, the operating record is unusually consistent. Revenue has compounded from Rp 18.5 trillion in 2021 to Rp 27.2 trillion in 2025, and profit attributable to owners has risen every year — Rp 508.9 billion, Rp 580.5 billion, Rp 650.8 billion, Rp 739.8 billion, Rp 814.0 billion — carrying basic EPS from Rp 41.45 to Rp 66.30 [4]. Gross margin has held in a narrow 8.1–8.7% band and operating margin near 5.3% throughout, so the growth is volume plus a slowly richer mix, not a one-off margin event [5].
Source: FY2025 Annual Report, 2025 Performance Highlights, five-year financial table [6].
The market moved the other way
The share price has done the opposite of the earnings. The stock reached an all-time high of Rp 845 on 5 January 2022; it closed at Rp 510 on 27 July 2026 — roughly 40% lower, over a period in which EPS rose about 60%. The compression is entirely in the multiple: at the peak the shares changed hands near 20 times trailing earnings, and today they sit at about 7.7 times FY2025 EPS of Rp 66.30. On the roughly 12.28 billion shares outstanding [7], Rp 510 implies a market capitalisation near Rp 6.3 trillion — just under the Rp 6.31 trillion of book equity the company reported at year-end [8].
P/E (FY2025 EPS)
Price / book
Dividend yield (trailing)
Valuation derived from Rp 510 close (Yahoo Finance feed, 27 July 2026) against FY2025 EPS, book equity and the FY2024 dividend of Rp 24.00 per share; peak of Rp 845 on 5 January 2022 per Simply Wall St price history.
Two things anchor the downside. First, the balance sheet is conservative: against Rp 1.30 trillion of cash the group carried only Rp 1.01 trillion of short-term and Rp 0.12 trillion of long-term bank debt at end-2025, a small net-cash position, and it held Rp 5.13 trillion of undrawn committed facilities [9]. Second, the company pays out roughly 40% of earnings — Rp 24.00 per share distributed in 2025, a 39.8% payout — for a trailing yield near 4.7% at the current price, with the payout ratio having climbed from the low-20s a few years earlier [10]. A business that grows, self-funds, and returns cash is not the usual profile of a stock priced at liquidation value.
The counter-fact a bull has to hold is a caveat to that net-cash comfort: short-term bank borrowings have tripled since 2023 (Rp 296 billion → Rp 770 billion → Rp 1,007 billion) to finance a growing working-capital book, so the net-cash cushion is thin and directionally shrinking, not a fortress [11].
Who owns it, and a wrinkle in the earnings
Metrodata is family-controlled. PT Ciputra Corpora — the Ciputra family holding company — owns 36.2% of the shares; President Commissioner Candra Ciputra holds a further 0.25% directly [12]. Two features of the register are worth a value investor's attention: a Singapore value manager, Pangolin Investment Management, sits on the top table with 6.4%, and long-standing holder Sukarto Bujung another 5.0%, with the public float at 35.4% [13]. The controlling family is aligned through a large economic stake; independent value capital already holds a seat.
There is one structural wrinkle a newcomer must not miss when reading the headline numbers. The distribution engine — most of group revenue — runs through PT Synnex Metrodata Indonesia, which Metrodata owns 50% [14]. Because that subsidiary is consolidated in full, the group reports 100% of its revenue but only half of its profit belongs to Metrodata shareholders. It shows up as a large minority leak: of Rp 1,143.9 billion of total comprehensive income in FY2025, only Rp 815.3 billion — about 71% — was attributable to owners of the parent [15]. The per-share figures above already net this out, but the headline "Rp 27 trillion revenue" overstates the shareholders' economic interest, and that gap is part of why the multiple looks the way it does. It deserves a chapter of its own.
What the Street expects next
Coverage is thin — one to three analysts — so forward estimates carry more uncertainty than the operating record. The available consensus looks for revenue near Rp 29.7 trillion in FY2026 and Rp 32.7 trillion in FY2027, with EPS around Rp 72.6 then Rp 79.9 — roughly 10% annual growth, an extrapolation of the recent trend rather than an inflection. Published 12-month price targets span Rp 800 to ~Rp 1,020, all above the current Rp 510, though on so few analysts the signal is weak. Momentum has, if anything, reaccelerated: Q1 FY2026 revenue grew 21.4% year on year.
Forward estimates and price targets: Simply Wall St and Investing.com consensus as of July 2026 (thin, 1–3 analyst coverage); Q1 FY2026 growth per company press release.
The question this report will answer
Metrodata presents a genuine tension. The evidence for a mispricing is real: a business that has grown revenue and owner's earnings every year, run conservatively, controlled by an aligned family, already held by a value fund, priced at about book value, under eight times earnings, and yielding near 5%. The evidence for a deserved discount is also real: it is fundamentally a ~3%-net-margin distributor whose largest engine is only half-owned, in a cyclical, capital-light business where scale does not automatically confer pricing power.
So the question the rest of this report exists to answer is this: is Metrodata's compressed valuation — roughly book value and under eight times earnings — the market correctly pricing a thin-margin distributor whose scale engine leaks half its profit to minorities, or is it mispricing a durable, conservatively financed proxy for Indonesian enterprise digitalisation that happens to grow? What matters more than the headline multiple is the quality of the earnings underneath it: how much of the growth belongs to shareholders, how durable the higher-margin solutions layer is, and whether the family runs the business for owners or for control.
Look-Through Earnings
Metrodata's distribution engine — 76% of group revenue — runs almost entirely through PT Synnex Metrodata Indonesia (SMI), a subsidiary the company owns 50% of but consolidates in full. On a look-through basis that engine delivers only about 40% of the profit that belongs to Metrodata shareholders; the higher-margin, wholly-owned Solutions business supplies the majority. The minority's half is real cash: Rp196 billion left the group in FY2025 dividends to the partner alone [1].
The engine sits in a half-owned subsidiary
Metrodata reports through two segments — Distribution and Solution and Consultation — but the Distribution business does not sit inside the parent [2]. It runs through a set of subsidiaries led by PT Synnex Metrodata Indonesia, the ICT-distribution vehicle Metrodata formed with Taiwan's Synnex Technology International (now part of TD SYNNEX) [3]. Metrodata holds 50% of SMI's shares and 50% of its voting rights [4].
That a 50/50 arrangement is consolidated in full — rather than equity-accounted as a joint venture — rests on a judgment the company flags as critical. Metrodata controls SMI because the current composition of SMI's board of directors, which holds decision-making authority over its planning, operating and financial policies, gives the parent the power to govern those policies and exposure to variable returns [5]. The consequence is arithmetic: SMI's entire Rp21.0 trillion of revenue and Rp7.1 trillion of assets are consolidated at 100%, while half of its equity and half of its profit belong to the partner [6].
The non-controlling interest on the balance sheet is almost entirely SMI: of Rp1,602.5 billion of NCI equity at end-2025, Rp1,595.1 billion — 99.5% — is the distribution partner's half of SMI, with two small subsidiaries making up the rest [7]. That NCI is a quarter of the group's Rp6,314.8 billion of total equity [8]. A second distribution subsidiary, PT Synnex Metrodata Technology and Services, is also 50%-owned, so the half-ownership pattern is specific to the distribution side of the house [9].
Source: FY2025 Annual Report, Note 20 Non-Controlling Interests [10].
Revenue optics versus owner earnings
On the segment page the two businesses look lopsided. Distribution sold Rp20.7 trillion to external customers in FY2025 against Solution and Consultation's Rp6.5 trillion — roughly 76% versus 24% of revenue [11]. But the two segments earn at very different rates. Distribution's gross margin is about 6% (Rp1,276.8 billion of gross profit on Rp21.4 trillion of segment revenue); Solutions runs near 15% (Rp950.0 billion on Rp6.5 trillion) [12]. Pre-tax, the gap narrows: Distribution contributed Rp843.0 billion of segment profit before tax and Solutions Rp591.5 billion — 59% versus 41% [13].
The ownership overlay changes the picture again. Because the Distribution engine is half-owned and Solutions is wholly owned, the share of profit that actually reaches Metrodata shareholders tilts toward the smaller, higher-margin business.
Sources: revenue split per FY2025 segment note [14]; owner-earnings split derived from Note 20 and the consolidated profit split [15].
The look-through works from the group's own numbers. SMI earned Rp656.3 billion of net profit in FY2025 [16]. Of the group's Rp1,143.1 billion of profit for the year, Rp814.0 billion is attributable to owners of the parent and Rp329.1 billion to non-controlling interests [17]. That NCI line is, within a rounding error, the partner's half of SMI — meaning Metrodata's own half is roughly the same, about Rp328 billion. The rest of owner profit, roughly Rp486 billion, comes from the wholly-owned Solutions business, its associates and the parent [18].
Source: derived from FY2025 consolidated profit split and Note 20 [19]; [20].
Distribution — share of revenue
Distribution — share of owner earnings
Minority share of group profit
FY2025 cash dividend to partner (Rp m)
Sources: FY2025 segment note [21]; consolidated profit split [22]; Note 20 [23].
So the headline that Distribution is three-quarters of the business is true of revenue and roughly true of pre-tax segment profit, but on the profit that reaches shareholders the weight flips: the wholly-owned Solutions layer and the parent are the majority, and the commodity distribution engine — for all its scale — is the minority contributor to owner earnings.
The minority's half is cash, not just an accounting line
The partner's share is not a paper adjustment that nets out below the line; it is settled in cash. SMI paid Rp196.2 billion of dividends to its non-controlling interest in FY2025 and Rp202.3 billion in FY2024 [24], following Rp143.3 billion in 2023 and Rp252.5 billion in 2022 [25]. Across those four years roughly Rp794 billion of cash left the group for the distribution partner. For scale, the parent paid its own shareholders Rp294.6 billion in FY2025, so the partner's draw runs at about two-thirds of Metrodata's own dividend [26].
Sources: FY2025 Note 20 for 2024–2025 [27]; FY2023 Note 20 for 2022–2023 [28].
SMI's distribution profit has ground higher — from Rp572.2 billion in 2022 to Rp656.3 billion in 2025 — but the retained share still accrues half to the partner, whose balance-sheet stake rose from Rp1,193.2 billion to Rp1,595.1 billion over the same window [29]. One footnote in the same disclosure is worth carrying into a later cash chapter: SMI generated only Rp58.6 billion of operating cash flow in FY2025 against its Rp656.3 billion of profit, the mark of a working-capital-heavy distributor [30].
What the split means for the thesis
The look-through cuts both ways against a simple reading of the multiple. The bear framing — a thin-margin distributor of which shareholders own only half — is accurate about revenue and the balance sheet, but overstated about earnings: the profit shareholders actually keep is majority the higher-margin, wholly-owned Solutions business, not the 6%-gross-margin distribution flow. The compounding a bull would pay up for lives in the part of the group Metrodata owns outright.
Two facts sit against reading this as hidden value. First, the reported multiple is not fooled by the structure. Per-share earnings of Rp66.30 and the roughly 7.7-times multiple are struck on the Rp814.0 billion that belongs to owners, not on consolidated profit, so the minority's half is already netted out of the valuation [31]. What stays contestable is whether a stream that is roughly 60% higher-margin solutions earnings should carry the distributor's multiple the shares trade on today. Second, the full consolidation of a 50/50 venture depends on a board-composition judgment rather than a majority stake [32]; a change in the TD SYNNEX relationship is a governance dependency that a look-through investor should price, even if the arrangement has been stable for years and both sides keep reinvesting in it [33].
The read that would change is a shift in either lever: SMI's ownership moving toward a majority stake — which would pull the distribution engine's earnings fully to owners — or the Solutions share of look-through profit continuing to climb, which would keep re-weighting shareholder earnings toward the business that compounds fastest.
Margin Engine
Metrodata's Solution and Consultation segment is the group's margin engine: roughly a quarter of revenue but about 43% of segment gross profit, at a gross margin near 15% that has held within a narrow band for four years while distribution margins drifted lower [1]. A Rp6.5 trillion order backlog running to 2032, plus recurring cloud, maintenance and managed-services income, gives it a durable base [2]. Its revenue, though, has been broadly flat since 2023.
The look-through economics (Look-Through Earnings) established that this wholly-owned Solutions business supplies the majority of the profit belonging to shareholders. Whether it deserves more than a distributor's multiple depends on what that segment actually is — a durable, moated services franchise, or a value-added reselling layer whose margin is capped and whose growth has stalled. This chapter tests that.
A quarter of the revenue, over 40% of the gross profit
The segment reporting splits Metrodata into two divisions: Distribution (sale of hardware and software) and Solution and Consultation, which the company defines as maintenance to keep systems running, sale of system-level software and serverware, and professional services for consultation, implementation and training [3]. The two earn their living very differently.
In FY2025, Solutions turned Rp6,465.0 billion of revenue into Rp950.0 billion of gross profit — a 14.7% gross margin — while Distribution needed Rp21,421.8 billion of revenue to produce Rp1,276.8 billion, a 6.0% margin [4]. So on 23% of segment revenue, Solutions delivered 43% of the combined Rp2,226.7 billion of segment gross profit. That ratio is not a one-year artefact.
Source: segment notes, FY2023–FY2025 Annual Reports [5] [6] [7].
Across four years the Solutions gross margin sat in a 13.8%–15.0% band, while Distribution drifted from 6.4% toward 6.0% [8] [9] [10]. The stability matters more than the level: a business whose margin holds through a national election year, a post-pandemic PC correction and a weakening rupiah is priced by different mechanics than a hardware reseller passing through principals' price lists [11].
Operating margin tells a more sober version of the same story. Solutions carries heavy people costs — Rp429.4 billion of operating expenses in FY2025, more than Distribution's Rp374.1 billion despite a third of the revenue — so its operating margin was 8.1%, against roughly 4.2% for Distribution [12]. Higher margin, then, but not a light-touch business.
Source: Solution and Consultation segment, FY2023–FY2025 Annual Reports (revenue on total net-revenue basis) [13] [14] [15].
How much of it recurs
A margin that holds is worth more if the revenue behind it repeats. Three disclosures suggest a meaningful part of the Solutions layer does.
The first is the split between revenue booked at a point in time and revenue booked over time. Of Rp27,177.8 billion of FY2025 net revenue, Rp22,957.1 billion was recognised at a point in time — the hardware-and-software pass-through — and Rp4,220.6 billion, about 15.5%, was recognised over time, the ratable services base [16]. Management attributes the Solutions unit's resilience to exactly this: steady recurring income from maintenance, cloud and managed services, backed by the loyalty of strategic clients in financial services, telecommunications, and oil and gas [17].
The second is the order book. At end-2025 the group carried Rp6,466.5 billion of unsatisfied performance obligations — contracted revenue not yet delivered — expected to complete anywhere from 2026 out to 2032, up from Rp6,166.6 billion a year earlier [18]. That backlog is roughly one full year of Solutions revenue already under contract, and its long tail is the signature of multi-year maintenance and managed-services agreements rather than one-off box sales.
The third is deferred revenue. Contract liabilities — cash collected ahead of delivery — rose to Rp1,568.9 billion from Rp1,446.4 billion, and Rp1,140.8 billion of prior-year contract liabilities converted into FY2025 revenue [19]. A growing deferred-revenue balance that reliably unwinds into sales is the working-capital fingerprint of a subscription-and-maintenance book.
Source: FY2025 Annual Report, Note 21 Net Revenue [20].
One more disclosure cuts the concentration worry a value investor would raise: no single customer accounted for more than 10% of net revenue in FY2025 [21]. The recurring base is spread across many enterprise accounts, not hostage to one.
What holds the clients — and what does not
The durable margin has to come from somewhere the customer cannot easily replicate. Metrodata's evidence points to accreditation and embedded systems rather than proprietary technology.
On the enterprise-application side, Metrodata's consulting unit holds SAP Global's Partner Center of Expertise, Application Management Services and Partner Quality Program certifications for products such as SAP All-in-One and SAP Business One [22]. An ERP system, once implemented, sits at the centre of a client's finance and supply-chain operations; the accredited implementer that installed it holds a switching cost measured in operational risk, not just fees. On the infrastructure side, the company positions itself as a primary partner of the three largest global hyperscalers, letting it broker multi-cloud architectures as clients migrate core systems off-premise [23]. Underneath both sits the talent base: Metrodata Academy ran more than 270 training classes for roughly 1,700 participants in 2025, feeding the vendor certifications the model runs on [24].
The eight-pillar portfolio shows where the growth is concentrated. Cloud is the largest revenue contributor, followed by Business Applications; Cybersecurity, Data and AI, and Hybrid IT Infrastructure are the faster-growing but still-small pillars [25]. That mix is squarely aligned with Indonesian enterprise digitalisation, and it is the part of the group a bull is really buying.
The counter-case sits in the same disclosures. The advantage is largely borrowed: cloud revenue is resold hyperscaler capacity and the ERP franchise is built on another vendor's platform, so the margin is capped by what the principals allow. Management says as much — as ERP shifts from on-premise to cloud, "certain services were increasingly handled directly by principals," reshaping the unit's revenue structure and forcing Metrodata to lean on new demand to offset the leakage [26]. The company's own risk register flags that weaker economic conditions delay ICT orders in the Solutions and Consulting business specifically [27].
And the margin is not capital-light. Solutions tied up Rp6,003.5 billion of segment assets at end-2025 — 46% of the group's segment assets on 23% of revenue — against Distribution's Rp7,146.1 billion, because long-dated contracts leave receivables and contract assets on the books [28]. Asset turnover of roughly one time revenue is closer to a project-services house than a software licensor.
A durable margin, a stalled top line
The clearest limit on the bull case is growth. After stepping up 23% in 2023, Solutions external revenue was essentially flat for two years — Rp6,208.5 billion in 2023, Rp6,187.8 billion in 2024, Rp6,464.3 billion in 2025 [29] [30] [31].
Source: segment notes, FY2023–FY2025 Annual Reports [32] [33] [34].
That 2025 gain leaned partly on a defensive move: the unit built teams to re-map thousands of dormant accounts and reactivate clients that had not transacted in two to three years, and management credits that reactivation for holding the year's revenue together [35]. Mining an existing base is a sign of a sticky book; it is not organic expansion.
The evidence supports a measured read. The Solutions margin is genuinely durable — a four-year band near 15%, an order book contracted to 2032, a diversified recurring base, and real accreditation-and-switching-cost advantages in ERP and cloud. That is more than a commodity distributor owns, and it is why the segment carries the majority of look-through owner earnings on a minority of revenue. But it is a value-added services layer built on principals' platforms, capital-heavy, margin-capped, and cyclically exposed, and it has not grown for two years. The read that would change is the top line: a return to double-digit Solutions revenue growth — led by the Cybersecurity, Data and AI, and Managed-Services pillars — would argue the market is under-pricing a compounder; another two flat years would say the distributor's multiple is close to right.
Over FY2022–FY2025 Metrodata reported Rp4,021bn of group net profit but generated only Rp256bn of operating cash and, after capital spending, Rp29bn of free cash — a conversion of under 1%. The shortfall is working capital: growth reinvests each year's earnings into receivables, inventory and contract assets, funded by a revolving bank line. Cash income taxes of Rp1,497bn over the same span confirm the profits are real; the gap is timing, not fabrication.
Profit that stays on the balance sheet
Metrodata's income statement and its cash-flow statement tell different stories. Group net profit rose every year from Rp867bn in 2022 to Rp1,143bn in 2025 [1] [2]. Operating cash flow did not follow: it was positive in 2022 and 2024 but negative in 2023 (−Rp74bn) and 2025 (−Rp70bn) [3] [4]. Across the four years the group earned Rp4,021bn of accrual profit and turned it into Rp256bn of operating cash and Rp29bn of free cash after capital expenditure.
Source: consolidated cash-flow statements and statements of profit or loss, FY2023–FY2025 annual reports; free cash flow = operating cash flow less additions of fixed assets [5] [6] [7].
The pattern is not a one-off. Cumulative operating cash flow was 6% of cumulative net profit; cumulative free cash flow was under 1%. For a business earning a steady ~17% return on equity [8], almost none of the reported return has arrived as spendable cash. It has stayed on the balance sheet, as working capital.
Where the cash goes: receivables, inventory, contracts
The FY2025 statement makes the mechanism concrete. The group actually collected Rp27,120bn from customers — about Rp58bn less than booked revenue as receivables grew — and paid Rp26,045bn to suppliers and Rp752bn to employees, leaving Rp323bn generated from operations [9]. Corporate income tax paid in cash, Rp400bn, exceeded that figure on its own; after Rp73bn of finance costs and Rp80bn of tax refunds received, net operating cash flow was negative Rp70bn [10].
Source: FY2025 Annual Report, Consolidated Statement of Cash Flows — cash generated from operations Rp322,964m; income tax paid Rp399,947m; net operating cash flow Rp(70,178)m [11].
The Rp323bn generated from operations was itself held down by growth. Of the Rp1,471bn rise in total assets in 2025, management attributes Rp605bn to higher trade receivables, Rp314bn to inventory and Rp279bn to contracts in progress [12]. Those three lines absorbed roughly Rp1.2tn — more than the entire year's group profit. The intensity is rising at the margin: receivable days lengthened from 54 to 58 and inventory days from 32 to 35 as the economy slowed, though management notes receivable quality was maintained [13].
Source: FY2025 Annual Report, Analysis of Consolidated Statement of Financial Position — increase in assets from trade receivables Rp605bn, inventories Rp314bn, contracts in progress Rp279bn [14].
The dividend runs on the revolver
Because free cash is minimal, the cash Metrodata returns comes from the balance sheet and from borrowing. In FY2025 the group drew Rp7,219bn of bank loans and repaid Rp6,921bn — a working-capital facility that turns over several times a year against year-end bank debt of only Rp1,130bn [15] [16]. The net Rp298bn of new borrowing, together with a Rp261bn drawdown of the cash balance, funded Rp295bn of dividends to shareholders and Rp196bn to the 50% Synnex minority [17].
Over four years the identity is stark. Rp1,654bn of total dividends — Rp859bn to owners, Rp794bn to the minority — was paid against Rp29bn of cumulative free cash flow, bridged by Rp1,129bn of net new bank borrowing and a Rp358bn fall in the cash balance [18] [19].
Free cash flow, FY2022–25 (Rp bn)
Dividends paid, FY2022–25 (Rp bn)
Cash tax paid, FY2022–25 (Rp bn)
Source: derived from consolidated cash-flow statements, FY2023–FY2025 annual reports — cumulative operating cash flow Rp256bn less capex Rp227bn = free cash flow Rp29bn; dividends to owners Rp859bn + to non-controlling interests Rp794bn; cash income tax paid Rp1,497bn [20] [21].
Why this is a working-capital story, not a warning
The gap is real and structural, but three facts place it firmly in the growth-and-working-capital column rather than the earnings-quality one.
First, the profits are demonstrably real. The group paid Rp1,497bn of income tax in cash over the four years — 37% of reported net profit, and in 2025 more than the entire cash generated from operations [22] [23]. A company manufacturing accounting profit does not hand that much to the tax authority.
Second, the working capital is short-dated and appears to self-liquidate. Receivables collect in under two months and inventory turns in about five weeks, with no single customer above 10% of revenue [24]. The reversibility showed in 2024: a slower-growth year in which cash receipts caught up with billings and operating cash flow swung to a positive Rp273bn [25]. The negative-cash years are the cost of growing, not evidence of a stuck balance sheet.
Third, the balance sheet absorbs the swing comfortably. The group ended 2025 with Rp1,299bn of cash [26] against Rp1,130bn of bank debt — still a small net cash position — a current ratio of 1.86 [27], and Rp5,134bn of undrawn committed facilities [28]. The revolver churn reflects an actively managed trade-finance line, not distress funding.
The read, and what would change it
For a value investor calibrating margin of safety, the takeaway is a qualification rather than a red flag. The look-through earnings that make Metrodata screen cheaply are genuine and cash-taxed, but at roughly book value and a 4.7% yield the payout is funded by the balance sheet and a growing revolver, not by free cash flow — so the yield is a claim on financing capacity, not on surplus cash. That is a defensible position while the business grows and the facilities stay open; it is the flip side of a distribution model that consumes cash precisely because it is expanding.
The condition that would change the read is already faintly visible. Receivable and inventory days both crept up in 2025 as demand softened [29]. If days keep rising without revenue growth to justify them, or if the cost or availability of the revolving facilities tightens, the model that pays dividends out of borrowing would come under strain. The reassuring mirror image is that a genuine pause in growth would release working capital and lift free cash sharply, as 2024 previewed — which is why the cash profile is best read as a function of the growth rate, not a fixed feature of the business.
The demand backdrop behind Metrodata is a real, quantified tailwind: Indonesian enterprise IT spending growing at low double digits, a hyperscaler data-centre build-out, and post-breach security demand — all sitting squarely in the eight solution pillars Metrodata sells. The 2025 record shows how that tailwind actually reaches the company: lumpy and diluted. A government budget freeze stalled its public-sector-heavy Solutions line even as the market grew, and most of the year's volume landed in the thin-margin distribution engine rather than the higher-margin one.
The market Metrodata sells into
Indonesia is one of the faster-growing enterprise-technology markets in the region, and the growth is broad-based rather than concentrated in a single product. On IDC's numbers — cited in peer PT Astra Graphia's outlook — company IT spending in Indonesia was set to grow about 12% in 2025, with software up 18%, IT services up 12%, and hardware up 8% [1]. That sits on an economy the World Bank expected to grow around 5.1% in 2025, with digital-economy expansion, cloud adoption and government support named as the structural drivers of data-centre and IT demand [2].
Third-party market sizing puts the opportunity in context. Independent estimates place Indonesia's total ICT market near USD 50 billion in 2025, its IT-services segment around USD 4.8 billion, and its data-centre market at roughly USD 2.4 billion in 2024 rising toward USD 3.8 billion by 2030 (IDC; Mordor Intelligence; IMARC Group). Against those pools, Metrodata's Rp21.4 trillion distribution business and Rp6.5 trillion Solutions business — roughly USD 1.3 billion and USD 0.4 billion — make it a material domestic participant, not a niche reseller [3] [4].
Source: IDC estimates as reproduced in PT Astra Graphia's FY2024 Business Outlook [5].
Three drivers that map onto the pillars
What makes this tailwind company-specific is how closely it tracks Metrodata's own portfolio. Three demand currents run through the multi-year record, and each corresponds to a named pillar.
Cloud and the data-centre build-out. Cloud has been the single highest-growth category Metrodata cites, and it is being fed by a hyperscaler capital cycle: Microsoft committed USD 1.7 billion to AI and cloud infrastructure in Indonesia and opened its Indonesia Central cloud region in May 2025, with Google and AWS running their own Jakarta regions. Metrodata's own 2023 investor deck already flagged cloud as the highest-growth segment and cybersecurity and hybrid IT close behind [6]. As the primary partner of the three largest hyperscalers, Metrodata rides this cycle — a point whose limits appear below.
Cybersecurity, after a public failure. In mid-2024 a national-scale breach — the June 2024 Brain Cipher ransomware attack on Indonesia's temporary National Data Centre, which disrupted 282 public services — shifted how both government and business think about digital security. Metrodata's FY2024 report records public-sector acceptance of cloud and security "beginning to increase" following the incident, with policymakers newly aware of the need for reliable, secure infrastructure [7]. The company has since built out managed security through its FPT Metrodata Indonesia subsidiary — a Security Operations Centre, penetration testing, and a lower-cost "Security Box" for smaller firms launched in 2025 [8].
Data and AI. Demand in the Data & AI pillar rose through 2025 as more firms sought to apply AI to productivity and decision-making. Metrodata's response has been to package the capability — Knowgen.AI for information-access agents, and the MEGAROCK suite of five ready-to-deploy AI solutions built on a global cloud provider — so customers adopt without building a technical foundation from scratch [9].
The arc across three years is coherent: a post-Covid digitalisation acceleration through 2023 across cloud, security, data & AI and IoT [10], a breach-driven security awakening in 2024, and an AI adoption wave in 2025. The demand direction is not in doubt.
The 2025 stall
The tailwind's strength did not translate into Solutions growth in 2025, and the reason is specific rather than secular. Entering the year, management had explicitly leaned into the public sector, aiming to become the largest B2B Data & AI player and naming public-sector expansion as a growth priority [11]. It then ran into Presidential Instruction No. 1/2025, President Prabowo's Rp306.7 trillion state-budget efficiency drive, which cut roughly Rp256 trillion from ministries and froze procurement, equipment and infrastructure lines. Metrodata's FY2025 report describes exactly this: a "policy-adjustment period in 2025" that delayed strategic government and state-owned-enterprise projects, with 2026 growth expected as those projects reactivate [12]. On the distribution side, consumer purchasing-power pressure held back notebook and PC sales early in the year before a Q3 rebound as domestic conditions improved [13].
This is the cyclical cause behind the flat Solutions top line documented in the Margin Engine: external Solutions revenue rose 23% in 2023, then held near Rp6.2 trillion in 2024 and Rp6.5 trillion in 2025. The plateau coincided with a public-spending freeze in a segment where government and state enterprises are a core customer — a policy air pocket, not evidence that the underlying market stopped growing. The read that would confirm this is a Solutions re-acceleration in 2026 as the frozen projects reactivate; the read that would break it is a second freeze or a structurally lower public-sector budget.
How much of the tailwind reaches shareholders
Where the demand lands matters as much as its strength, and 2025 answered that plainly. From 2023 to 2025 the distribution segment's external revenue grew about 30%, from Rp15.9 trillion to Rp20.7 trillion, while Solutions grew about 4%, from Rp6.2 trillion to Rp6.5 trillion [14] [15].
Source: Segment note, FY2024 Annual Report (2023 column) [16] and FY2025 Annual Report (2025 column) [17].
Two structural features explain the split. First, much of the technology tailwind reaches Metrodata as an intermediary rather than a principal: cloud revenue is resold hyperscaler capacity, so the data-centre capital cycle behind that USD 1.7 billion hyperscaler build-out flows through as distribution and resale volume at the ~6% gross margin documented in the Margin Engine, not as owned, high-margin software. In 2025 the distribution engine grew 9% to Rp21.4 trillion, led by low-end smartphones and by Network & Cybersecurity products in the Commercial segment — real demand, captured mostly in the thin-margin business [18] [19]. Second, that distribution growth is further diluted before it reaches owners, because the distribution engine sits in a 50%-owned subsidiary — the mechanism set out in Look-Through Earnings.
The reasonable read is that the industry tailwind is genuine, durable and well-matched to what Metrodata sells, but that it reaches shareholders diluted — by the intermediary margin and the minority interest — and lumpy, gated by a public-sector customer base that swings with the state budget. The strongest fact on the other side is breadth: the demand runs across eight pillars [20] with no single customer above 10% of revenue [21], and even in a weak year distribution still grew 9%, so no single tailwind reversing would break the model. The demand backdrop supports the growing-digitalisation-proxy half of the case; it does not, on its own, guarantee that the growth compounds in owner earnings.
Metrodata is controlled, not owned outright, by the Ciputra family: PT Ciputra Corpora holds 36.21%, and four family members are the ultimate beneficial owners [1]. Day-to-day the company is run by career professional managers who own almost none of it, with no equity incentive plan. Alignment shows up in a clean related-party ledger and zero share dilution; the tension is a dividend that has quietly drifted above its own stated policy while, as shown elsewhere, free cash flow does not cover it.
Control without a majority
The register is unusually legible for an Indonesian family company. PT Ciputra Corpora — the family holding vehicle whose ultimate beneficial owners are Candra Ciputra, Rina Ciputra Sastrawinata, Junita Ciputra and Cakra Ciputra — is the sole controlling shareholder at 36.21% [2]. That is control, but not a majority: nearly two-thirds of the equity sits outside the family vehicle. A second individual, Dra. Medya Lengkap S., holds 16.60%, and Sukarto Bujung 5.03% — large, long-standing holders the filings do not disclose as affiliated with the family. Singapore value fund Pangolin Investment Management holds 6.43%, and the public float is 35.43% [3].
Source: FY2025 Annual Report, Shareholding Composition; directors & commissioners = Candra Ciputra 0.25% + Susanto Djaja 0.04% + Ben Widyatmodjo 0.01% [4].
Two features matter for how the family's incentives run. First, the controlling stake is meaningful in absolute money: 4.45 billion shares at the July 2026 price of Rp510 are worth roughly Rp2.27tn, against a group market capitalisation near Rp6.26tn — the family's wealth rises and falls with the minority's. Second, the family reaches the business through supervision, not operation. Candra Ciputra chairs the Board of Commissioners (the supervisory tier), having served as Vice President Commissioner from 2003 and President Commissioner since 2011, reappointed to 2029; his executive day job is President Director of the family's property flagship, PT Ciputra Development Tbk, alongside chair and commissioner seats at several other Ciputra-group companies [5]. Metrodata is one holding in a property-led dynasty, overseen rather than founder-run.
Skin in the game, and where it isn't
For an investor who prizes owner-operators, the distinction between the family and the operators matters. The people who actually run Metrodata hold almost no stock. President Director Susanto Djaja — with the company since 1997 and CEO since 2010 — owns 0.04%; Candra Ciputra holds 0.25% personally on top of the family vehicle; Vice President Commissioner Ben Widyatmodjo 0.01%. Together the named directors and commissioners hold 0.29% directly [6]. There is no mechanism to grow that stake: the company states plainly that it runs no performance-based long-term compensation program for management or staff, judging it unnecessary [7]. Management alignment therefore comes from tenure and career, and from the family's controlling block above them — not from personal equity.
The flip side of no equity plan is no equity dilution. The share count has not moved — 12,276,884,585 shares, one vote each — and the FY2025 accounts confirm the company has no dilutive instruments, so basic and diluted EPS are identical [8]. Insiders are not selling, either: across FY2024 and FY2025 the family vehicle's 4,445,968,890 shares were unchanged, and the only board-level move was Ben Widyatmodjo adding a token 107,500 shares [9]. A minority buys in alongside a family whose stake is static and undiluted — but also alongside operators with little of their own capital at risk.
What the family takes: pay, then the payout
Two channels return value to those in control: compensation and dividends. On pay, the disclosure is aggregate-only — Indonesian filings do not split it by individual — but the total is modest and stable. Key management personnel (the boards of directors and commissioners together) received Rp94.8bn in FY2025, up 4.8% from Rp90.5bn, of which Rp91.9bn was short-term benefits and Rp2.9bn post-employment [10]. Against FY2025 profit attributable to owners of Rp814.0bn [11], that is 11.7% — a meaningful slice, but one that is entirely cash, disclosed, and not topped up by options or grants.
Source: FY2025 Annual Report, Note 24 — key management personnel compensation Rp94,831m (2025) and Rp90,491m (2024); Note 23 — profit attributable to owners Rp813,992m (2025); FY2024 owner profit Rp739,804m; comp % computed [12] [13].
The dividend is the more consequential channel. Metrodata's written policy is to pay 20–30% of net income after tax [14]. The cash dividend per share has risen every year on the current share base — Rp10.5 (2022), Rp14.5 (2023), Rp21 (2024), Rp24 (2025) — and, more tellingly, the payout ratio has climbed straight through the top of that policy band, from 25.3% and 30.7% to 39.6% and 39.8% in the last two years [15]. The Rp294.6bn paid in 2025 sits at roughly 40% of earnings against a stated ceiling of 30% [16].
Source: FY2025 Annual Report, Dividend Policy — dividend per share and cash dividend payout ratio, dividends paid 2022–2025 on the respective prior fiscal year's net income [17].
Rising payout is, in isolation, shareholder-friendly. The complication established in Cash Conversion Gap is that free cash flow over FY2022–FY2025 was under Rp30bn, so the dividend is bridged by the revolving bank line rather than paid from surplus cash. A payout drifting above its own policy ceiling while the cash to fund it is borrowed is where the family's interest in a steady, growing distribution and the minority's interest in a self-funding balance sheet do not perfectly align. It is not extraction on a scale that endangers the balance sheet — net cash still exceeds debt — but it is the pressure point to watch.
A clean ledger, a thin independence
What is not in the accounts is as important as what is. The classic value-trap fear in a family-controlled emerging-market company — cash tunnelled to the controlling group through related-party dealing — does not appear. The only significant related party transacting with Metrodata is associate PT Packet Systems Indonesia, and the amounts are small: Rp177.5bn of revenue (0.7% of net revenue) [18] and a Rp62.5bn receivable (0.5% of assets) [19]. There is no disclosed flow of goods, services or loans to the Ciputra property empire. For this reader, the absence of tunnelling is a genuine mark in the company's favour.
Board independence, however, is thinner than the label suggests. The Board of Commissioners has three members, of whom one is designated independent — Dr. Tanan Herwandi Antonius. His own biography records 31 years inside the Ciputra Group (1987–2018, last role Senior Director) and a current seat as Independent Commissioner and Audit Committee Chair at PT Ciputra Development, the family flagship [20]. The sole independent overseer is thus a career man of the controlling family's own group. Engagement is also light at the top: Candra Ciputra, spread across the property empire, attended three of five Nomination and Remuneration Committee meetings in 2025 [21]. Oversight rests, in practice, with the family and with outside holders like Pangolin, not with an independent board.
The read
On balance this is closer to the "strong promoter" a value investor looks for than to a governance red flag. The family's money moves with the minority's, the stake is static and undiluted, pay is modest and cash-only, and the related-party ledger is clean — the markers of minority expropriation are simply not present. The honest qualifications are three: the family supervises rather than operates, so the operators themselves carry little equity and no incentive plan; the one independent commissioner is a 31-year insider of the controlling group; and the dividend now runs above its stated policy on borrowed cash. None of these is disqualifying, but together they mean the alignment is structural — through control — rather than the owner-operator kind. The read would tighten to negative if related-party transactions with the Ciputra group appeared, if a dilutive equity scheme were introduced, or if the payout were pushed higher still while leverage climbed; it would strengthen if the family moved to a formal, cash-covered payout or added genuinely independent oversight.
Metrodata's management keeps the promises it puts a number on and misses the one it only implies. Owner profit has grown double digits every year for four years, and cash dividends have run above the stated policy — exactly the reliability a conservative buyer wants. But the years-long promise to move up the value chain into higher-margin solutions has left the consolidated gross margin flat at roughly 8% for five straight years. On the record, this team can be trusted to compound the distributor, not to re-rate the economics.
What they promise, and what arrives
Metrodata does not issue detailed guidance. Management commits publicly to a single, loose figure — "around 10%" revenue growth — and re-states it each year: it targeted roughly 10% for 2025 [1] and, in June 2026, held firm on a 10% revenue-growth target for 2026 despite component-price and rupiah pressure [2]. Against that modest bar, the delivery record is consistent.
Revenue and owner-profit growth and gross margin, FY2022–FY2025, from the five-year financial highlights [3].
Revenue growth is lumpy — a soft +5.2% in 2023, a strong +13.9% in 2024 — but it averages about 10% a year over the period, and the profit line is steadier still: profit attributable to owners rose Rp508.9bn → Rp580.5bn → Rp650.8bn → Rp739.8bn → Rp814.0bn, a double-digit gain in every single year [4]. In 2025 the company grew revenue 8.1% and owner profit exactly 10.0% [5] — a slight miss on the ~10% revenue target, a clean hit on the bottom line. A management that under-promises and lands inside its band four years running is a genuine mark in its favour.
Two cautions keep this from being more than it is. The guidance is a single loose number, so "meeting guidance" is a low bar to clear. And the body that formally grades the directors — the Board of Commissioners, which pronounced them "effective" for 2025 [6] — is chaired by the controlling family, so the self-assessment is not independent scrutiny (see Stewardship and Payout).
The promise that never reached the P&L
The larger claim management has made for years is not about growth rate but about mix — that Metrodata is steadily becoming a higher-value business. The 2023 report framed the eight-pillar Solutions unit, launched in 2018, as the engine of growth and noted its contribution to sales "has increased significantly" over five years [7]; the 2025 outlook committed the company to "cementing its position as the leading player in the B2B Data & AI segment," diversifying into Cloud, Cybersecurity and Data & AI [8]. It is a coherent, repeated strategy. The problem is that it has not moved the margin owners actually receive.
Gross and operating margin have stayed inside a narrow band for five years despite the stated shift toward higher-value solutions [9].
Five years of "moving up the value chain" show up as a gross margin that ranged from 8.14% to 8.65% and ended 2025 at 8.21% — no higher than where it started, and lower than 2023 [10]. Operating margin sat in a 5.1%–5.5% band, and return on equity drifted gently down, from 18.4% in 2021 to 17.3% in 2025 [11]. The mechanism is the one this report has traced elsewhere: the higher-margin Margin Engine is only about a quarter of revenue and its external growth has stalled, while the low-margin distribution business carried the volume — most visibly in Q1 2026, when revenue jumped 21.4% led by smartphones up 45.5% [12]. The transformation narrative is not false; it simply has not reached the consolidated P&L. The consolidated P&L still describes a distributor, so that is what a buyer underwrites.
One promise has produced nothing visible at all. The 2023 report said the company would pursue "inorganic growth" through "acquisitions or venture capitals" related to its core business [13]. No material acquisition has appeared in the record since; the ambition remains an aspiration rather than a track record, which is worth remembering whenever management points to inorganic optionality.
Where they over-deliver
The credibility case is not one-sided. On the promises management controls most tightly — cash return and balance-sheet safety — it does more than it says. The stated policy is to pay 20–30% of net profit; in practice the payout has run near 40%, with Rp294.6bn distributed in 2025 on FY2024 earnings [14] and the June 2026 AGM approving a Rp27/share dividend equal to 40.7% of FY2025 profit [15]. And the balance sheet has stayed conservative through the growth: the Commissioners noted 2025 equity rose 11.5% on disciplined working-capital management [16]. Both are real, both are kept, and both matter for the solvency floor a margin-of-safety buyer leans on — with the one caveat that the above-policy dividend has been part-funded by the revolver rather than by free cash flow, as Stewardship and Payout sets out.
Continuity and its blind spot
Metrodata is run by a small, long-tenured team supervised by the controlling family. President Director Susanto Djaja joined the company in 1997, became a director in 2007 and has been chief executive since 2010 [17] — roughly sixteen years at the helm, with the Ciputra family chairing the supervisory board. That continuity is part of why the record is so steady, but it concentrates institutional knowledge in a few people whose direct ownership is negligible; succession has not been tested, and alignment rests on family control and career rather than equity (see Stewardship and Payout). It is a stability that has served shareholders well and a dependency they should price.
The read on management
Weighing it up: management's word is bankable on the modest, controllable commitments — grow around 10%, raise the dividend, keep the balance sheet safe — and it has kept them four years running, which is exactly what this business needs to be worth its multiple. What it has not delivered is the more valuable promise implied by years of "higher-value" strategy: the consolidated margin is flat and ROE is edging lower. So credibility supports the reliable-compounder base case.
The strongest fact on the other side is that the record is genuinely good: owner profit still compounded about 12.5% a year over four years at a steady ~17% ROE, and 2025's margin dip owes something to the government budget air-pocket and to component-cost and currency pressure rather than to a failed strategy (see Industry Tailwinds) — so the transformation could still be early rather than absent. What would change this read is specific and watchable: gross margin breaking sustainably above roughly 9% while the Solutions unit's external revenue re-accelerates. That, not another year of on-target volume, would be the evidence that management's higher-value promise is finally reaching owners — and it is the same condition the Priced-In Expectations case identifies.
Metrodata's operating record is unglamorous but consistent: revenue and owner earnings have risen every year, on a stable ~3% net margin, funded from the balance sheet. At Rp 510 the shares trade at about 7.7 times FY2025 owner earnings — a valuation that embeds perpetual owner-EPS growth near 7%, well below the ~12% delivered and the ~10% analysts expect. The figure that gets a value screen interested is the balance sheet, and that is where the price is easiest to misread. The de-rating that left Metrodata at 7.7x earnings looks cheap only on the income statement: its FY2022-FY2025 profits converted into just Rp29bn of cumulative free cash flow (0.7% of Rp4,021bn group profit), and on the Rp4,712bn of equity that actually belongs to owners the stock trades at 1.33x book (Rp384/share at Rp510), not the ~1.0x the total-equity headline implies.
Put plainly: the ~1.0x-book screen is not the price of the assets shareholders own. It bundles Rp 1.60 trillion of minority equity into the denominator; on the Rp 4,712 billion of book that actually belongs to owners the multiple is 1.33x, and those book assets throw off almost no free cash — Rp 29 billion over four years. The stock is cheap on the P&L, not on the assets, and that removes two floors a value buyer would normally reach for: there is no discount to net assets and no free-cash cushion. The downside rests on the earnings and solvency floors alone — a 12.9% owner-earnings yield, net cash, and Rp 5.13 trillion of undrawn facilities — developed in this chapter's margin-of-safety section. The counter-fact belongs in the same breath: the earnings are real, not an accrual mirage. Rp 1,497 billion of cash tax was actually paid over FY2022–FY2025, and the free-cash shortfall is the cost of financing growth off the balance sheet, not a sign of distress.
This chapter lays out the three-year financial record and the forward estimates as a dedicated section — a standing request from the reader — and then does the reverse work: what the price actually assumes, how much pessimism is in it, and where the margin of safety sits.
The three-year record
The consolidated income statement is a study in low-margin consistency. Over FY2022–FY2025 net revenue compounded about 9% a year to Rp 27.2 trillion, gross margin held a narrow ~8.2–8.7% band, and owner earnings rose from Rp 580 billion to Rp 814 billion [1] [2]. Nothing in the five-line statement is dramatic; the interest is in what survives to owners. Basic EPS rose from Rp 47 to Rp 66 on an unchanged 12.28 billion shares — the company holds no dilutive instruments, so per-share growth tracks profit exactly [3].
Consolidated statements of profit or loss, FY2022–FY2025; operating profit shown is gross profit less operating/SG&A expenses (the statement carries no separate operating-profit line). FY2024–FY2025 per [4]; FY2022–FY2023 per [5].
Two features of this table carry the whole valuation debate. First, the net margin to owners is thin and flat — Rp 814 billion on Rp 27.2 trillion is 3.0%, essentially where it sat in 2022. This is a distribution-weighted business; volume, not margin, is the growth lever. Second, the minority column is large and sticky: Rp 329 billion of FY2025 profit — 29% of the group total — never reaches Metrodata shareholders, the mechanical consequence of consolidating the 50%-owned Synnex Metrodata Indonesia distribution engine in full, examined in Look-Through Earnings. Owner earnings are the right denominator for every multiple that follows, and this chapter uses no other.
Forward estimates, and where they leak
Coverage is thin — one to three analysts — so the forward numbers are an extrapolation of the trend, not an independent forecast. Consensus looks for revenue near Rp 29.7 trillion in FY2026 and Rp 32.7 trillion in FY2027, with owner EPS around Rp 72.6 then Rp 79.9: roughly 10% annual growth on both lines, in line with the delivered record.
FY2025 actual per the audited accounts [6]; FY2026e–FY2027e are Simply Wall St / Investing.com consensus as of July 2026 (thin, 1–3 analyst coverage), held in data/estimates/analyst_estimates.json.
The near-term tape is stronger than 10% suggests. First-quarter FY2026 revenue grew 21.4% year on year, to Rp 6.71 trillion — the kind of print that would normally pull estimates up. But it illustrates precisely why owner-EPS estimates stay modest: of the incremental profit, most went to minorities. Group profit rose 9.4% in the quarter while profit to owners rose just 3.4%, because the non-controlling share jumped 25% — the reaccelerating engine is the half-owned distribution business, so half its extra profit leaks before it reaches Metrodata holders, and gross margin slipped from 7.9% to 7.6% besides [7]. A revenue reacceleration is not, by itself, an owner-earnings reacceleration here. The forward case is most sensitive to whether growth reaches owners, and that qualifier connects the demand recovery traced in Industry Tailwinds to the cash reality of Cash Conversion Gap.
What Rp 510 implies
The arithmetic is straightforward. On 12.28 billion shares, Rp 510 is a market capitalisation near Rp 6.3 trillion. Against FY2025 owner earnings of Rp 814 billion that is 7.7 times trailing, falling to about 7.0 times the FY2026 estimate and 6.4 times FY2027.
Multiples struck on the Rp 510 close of 27 July 2026 (price feed, data/prices/daily.json) against FY2025 owner earnings and EPS [8], owner equity [9] and the FY2024 dividend of Rp 24.00 [10].
One correction matters before going further. Screens that show Metrodata at "about book" are using total equity of Rp 6.31 trillion, which bundles Rp 1.60 trillion of minority interest; equity attributable to Metrodata owners is Rp 4.71 trillion [11]. On the figure that belongs to shareholders, book value is Rp 384 a share and the stock trades at 1.33 times it, not 1.0. It is cheap on earnings; it is not a below-asset-value play.
Now the reverse question. A simple single-stage model — price-to-earnings equals payout divided by (cost of equity minus growth) — lets the current multiple imply a perpetual growth rate. At a ~40% payout [12] and a cost of equity of 12–14% (an Indonesian rupiah rate: ~7% government yield plus an equity and small-cap premium), a 7.0x forward multiple embeds perpetual owner-EPS growth of only about 6–8%. That is the pessimism, quantified: the price assumes Metrodata slows to roughly two-thirds of the ~12% it has actually compounded, and below the ~10% consensus still models.
Delivered = FY2022–FY2025 owner-EPS CAGR (Rp 47 → Rp 66); consensus per the estimates feed; implied = single-stage Gordon model at ~40% payout and a 12–14% cost of equity. Illustrative — the range, not the point estimate, is the message.
The single-stage model is a blunt instrument, and I would not defend the 7% to a decimal. But the direction is robust across any sensible discount rate: at 7 times earnings, a business does not need to grow to justify the price — it needs only to not shrink. Everything above roughly mid-single-digit growth is upside the market is presently declining to pay for.
Where the margin of safety sits — and does not
For a value investor the relevant question is what protects the downside if the growth never shows. Three floors sit under the shares, and one expected floor is absent.
- An earnings floor. A 12.9% trailing owner-earnings yield, on profits proven real by Rp 400 billion of cash tax actually paid (per Cash Conversion Gap), is a wide starting spread over the rupiah cost of capital.
- A cash-return floor. A 4.7% dividend yield, on a ~40% payout the company has sustained and lifted [13], pays the holder to wait — though, as Stewardship and Payout shows, that dividend has lately been bridged by the revolver rather than by free cash.
- A solvency floor. Against Rp 1.30 trillion of cash the group carried only ~Rp 1.13 trillion of bank debt and held Rp 5.13 trillion of undrawn committed facilities at year-end [14]. A small net-cash position and a 1.86 current ratio put the chance of the bankruptcy this reader most fears near zero.
- The floor that is not there. This is not a deep-asset play. At 1.33 times owner book the shares carry no discount to net assets to fall back on, and free cash conversion to owners has been near zero during growth years. The safety here is earnings- and balance-sheet-based, not asset-based — a distinction worth keeping straight before sizing the position.
Cheap, but explained
The pessimism in the price is genuine and measurable: Rp 510 pays for a permanent deceleration Metrodata has not yet shown, in a business that self-funds, returns cash, and is run for near-zero bankruptcy risk. That is the mispricing case, and it is not weak.
It is also, in part, earned. The reasons the multiple stays low are the same ones the earlier chapters documented — half the growth engine leaks to minorities, thin distributor margins convert volume to owner profit slowly, and free cash to owners has barely appeared. The Q1 FY2026 print is the tell: a 21% revenue surge that lifted owner earnings 3.4%. So the re-rating trigger is specific. It is not more revenue, and not a louder tailwind. It is evidence that incremental growth reaches owners — owner-EPS reaccelerating and, above all, working capital releasing so that owner free cash turns positive. Until one or both appear, 7 times earnings is cheap-but-explained rather than a mispricing a cautious investor can bank on. Should owner free cash flow turn durably positive while Solutions growth resumes, the same 40% payout and mid-cycle growth would support a multiple closer to 10–12 times — and that, not the tape, is the variable to watch.
This chapter reconciles the report into three paths for the earnings that belong to Metrodata shareholders, and the readings that show, quarter by quarter, which path the company is on. All three turn on whether growth reaches owners, so they are built on owner earnings, not revenue. The market prices something close to the weaker paths; the stronger one is reversible and unpaid for.
What separates the scenarios
Metrodata's FY2025 accounts show why the headline and the owner's share diverge. Group profit was Rp 1,143.1 billion; of that, Rp 813.99 billion belonged to owners of the parent and Rp 329.1 billion — 28.8% — to non-controlling interests, almost all of it the minority half of the Synnex Metrodata Indonesia distribution business [1]. The Look-Through Earnings and Margin Engine chapters traced the consequence: distribution supplies about three-quarters of revenue but only ~40% of owner profit, while the wholly-owned Solutions business supplies the majority. So the variable that moves owner EPS is not how fast the top line grows — it is which engine grows. First-quarter FY2026 made the point in miniature: revenue rose 21.4% but profit to owners rose only 3.4%, because the reaccelerating engine was distribution and the minority share jumped with it [2].
That mechanism, applied to the FY2025 base of Rp 66 owner EPS [3], defines the range below. The delivered record is roughly 12% owner-EPS growth over FY2022–FY2025 (Rp 47 to Rp 66) [4]; thin analyst consensus models about 10%; the reverse-DCF work in Priced-In Expectations put what the Rp 510 price actually assumes at roughly 6–8% in perpetuity. The three scenarios bracket that.
Three paths for owner earnings
Illustrative. Owner-EPS grown three years off the FY2025 base of Rp 66 [5]; exit multiples chosen around the current 7.7x trailing; price change is capital only, excluding the ~5% dividend. The spread across the paths matters more than any single point estimate.
Three things stand out when the paths are laid side by side. First, the bear case is not a collapse — it is a continuation of exactly what Q1 FY2026 showed, with distribution-led revenue growth diluted by a rising minority share, and it leaves the stock roughly where it is. At about 7x on flat-to-slow owner EPS, the price barely moves; the reader is paid the dividend to wait. Second, the gap between bear and bull is asymmetric: the downside path is a flat share price plus a yield, while the upside path roughly doubles the stock over three years, and it arrives only if the higher-margin, wholly-owned Solutions engine grows faster than distribution again, so that incremental profit stops leaking. Third, the base case is close to what the tape and consensus already carry, which is why it is the least interesting of the three: near-10% owner-EPS growth held at today's multiple returns roughly the earnings growth plus the yield, and nothing re-rates.
Where the price sits against the paths
The reverse-DCF in Priced-In Expectations implied about 6–8% perpetual owner-EPS growth at Rp 510 — which lands between the bear and base scenarios. On owner earnings of Rp 813.99 billion and 12.28 billion shares, Rp 510 is a market capitalisation near Rp 6.3 trillion, or 7.7 times trailing and about 7.0 times the FY2026 consensus of Rp 72.6 owner EPS [6]. The market is therefore pricing something close to the bear-to-base band and giving the bull path no credit.
The margin of safety the reader looks for rests on an earnings-and-solvency floor, not an asset floor — the full three-leg treatment sits in Priced-In Expectations, and the scenarios need only its shape. Solvency holds: net cash, a current ratio near 1.9x, and Rp 5,134 billion of undrawn facilities [7] [8]. Income holds too: a ~13% owner yield plus the Rp 27 dividend approved at the June 2026 AGM, roughly 41% of owner earnings [9]. The asset leg is the one that is absent. The de-rating that left Metrodata at 7.7x earnings looks cheap only on the income statement: its FY2022-FY2025 profits converted into just Rp29bn of cumulative free cash flow (0.7% of Rp4,021bn group profit), and on the Rp4,712bn of equity that actually belongs to owners the stock trades at 1.33x book (Rp384/share at Rp510), not the ~1.0x the total-equity headline implies [10]. So the return depends on owner earnings compounding, and the strongest fact against that is Q1 FY2026, where they barely grew while revenue surged [11].
What to watch
The scenarios are distinguished by six readings, each disclosed quarterly, and each already carrying a current value that points more toward the bear than the bull. Management, for its part, reaffirmed a 10% revenue-growth target for 2026 at its mid-year update, citing component-price and rupiah pressure — a growth signal that, on the mechanics above, matters for owners only if the mix moves with it.
Current readings: NCI and the owner-EPS spread from the FY2025 accounts and Q1 FY2026 interim [12] [13]; Solutions revenue from the segment note [14]; borrowings and the cash bridge from the capital-structure note [15]. The 2026 reactivation context is developed in Industry Tailwinds; the 10% target was reaffirmed in a June 2026 IDNFinancials report.
The readings that separate the paths are the same handful the report has built toward, and they are visible without waiting for a full year: whether operating cash starts covering the dividend, whether Solutions grows faster than distribution, and whether the minority share of profit turns down rather than up. A single clean quarter would not settle it — the working capital swings the Cash Conversion Gap chapter documented can flatter or flatter-in-reverse any three months — but two or three consecutive quarters in which owner EPS grows in line with revenue, the revolver stops rising, and NCI's slice narrows would move the company off the bear path the price currently assumes. The absence of those, with distribution still doing the growing, would confirm it.